
This blog is a break from the normal security focus of articles I write but I do have other interests outside of security! I drive an Electric Vehicle and one of my side projects gives me access to a large amount of data on EV journeys, close to 1,000,000 miles worth. With that much data you can start to identify some very interesting trends, let's take a look!
The data
At the time of writing I'm looking at data on 964,753 EV Miles collected over 110,690 EV Trips from 443 participants.

The API for the Nissan Leaf allows you to do many things and one of them is to extract the driving logs for the vehicle that detail many things including date, time, distance and power usage. This is the data that this analysis will be based on. I've already identified some really interesting trends and patterns in the data and I'm sure there is more that can be done too, so let's dig in!
Driving efficiency based on trip length
One of the first metrics I wanted to look at was how efficiently people drive based on the length of the trip they took. This is easy to calculate by looking at the total distance covered during the trip and the total amount of power consumed from the battery.
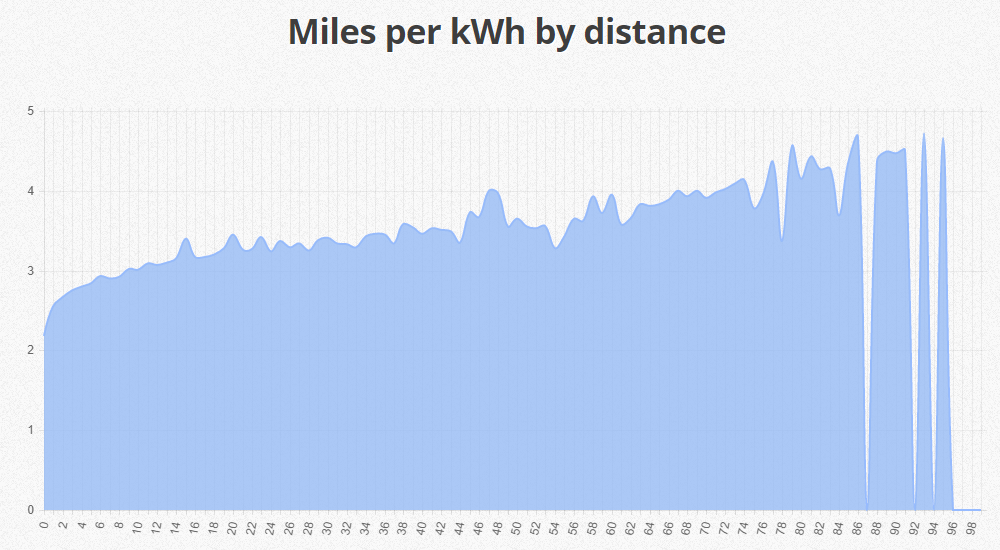
On the x axis we have the distance covered in a trip and on the y axis is the average economy for all trips of that length. It's fairly clear that the longer a trip the driver is going to take, the more efficiently they drive. This makes total sense as the longer a given trip is, especially if it's going to be followed by a return trip of the same length, the closer you will get to using up 100% of the battery power. If you want to do a trip of 90+ miles you have to drive efficiently as you're going to be consuming all of the power in the battery.
From the very worst economy of 2.18m/kWh to the very best economy at 4.72m/kWh there is a pretty significant gap. On the different models of the Nissan Leaf that would equate to the following ranges on a 100% charge:
24kWh (21.5kWh usable) - 46.87 miles to 101.48 miles
30kWh (28.0kWh usable) - 61.04 miles to 132.16 miles
40kWh (38.4kWh usable) - 83.712 miles to 181.248 miles
60kWh (57.6kWh usable) - 125.568 miles to 271.872 miles
From my own experience of 3+ years driving an EV this is what I'd expect to see in the data. On shorter trips I'm generally far less concerned with efficiency because I know there's plenty of battery available, resulting in a heavier right foot. Not only that but whilst the car is getting warmed up or cooled down on a shorter trip the energy use is probably relatively higher, a bit like petrol cars don't quite hit their stride until they're warmed up.
The value of regenerative braking
Another great feature of an EV is the ability for it to recharge the battery during normal operation. During braking, instead of the battery powering the motors to turn the wheels, the motors become generators and charge the battery. This has a nice secondary effect of reducing wear on the braking system too, regenerative braking can be used to great effect.
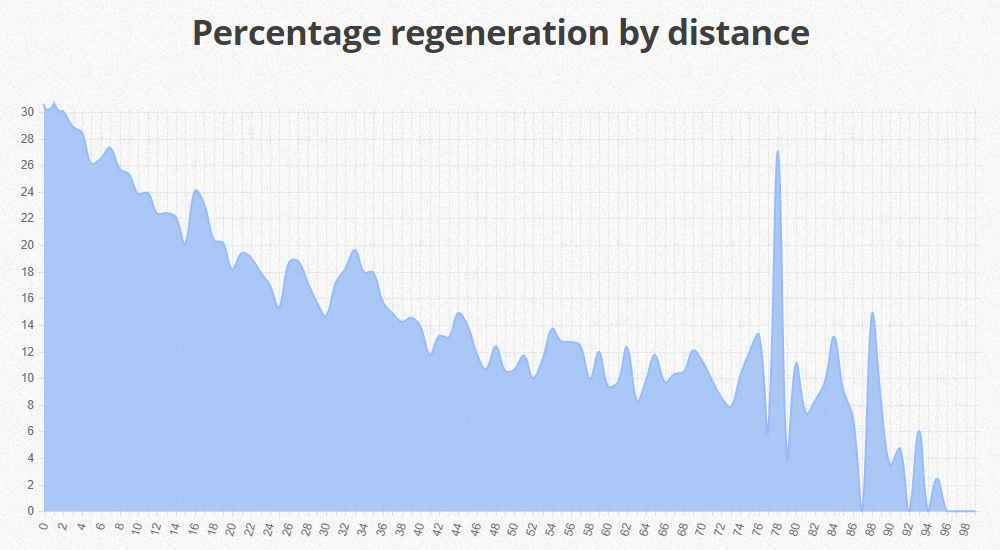
On this graph we have the x axis showing trip length in miles and the y axis is the average amount of power used during the trip that came from regeneration. What we see on the graphs is that the shorter the trip, the more power is recovered from regeneration. Relating to my own personal experiences again this does align with what I'd expect. Shorter trips are much more likely to be local, with lots of stop/start traffic caused by junctions, traffic lights, roundabouts and various other road features. The longer the trip the more likely it is to include motorway/highway which are generally a steady speed with considerably less braking.
The shorter trips see a great boost from regenerative braking with many of them seeing well over 25% of the power consumed coming from regenerative braking instead of from the charge in the battery. A 25% reduction in power consumption is pretty significant!
Total power used on a trip
This metric is going to fall in line with what everybody is probably thinking; The longer the trip, the more power will be used. I've also overlaid the amount of power taken from regeneration to the total.
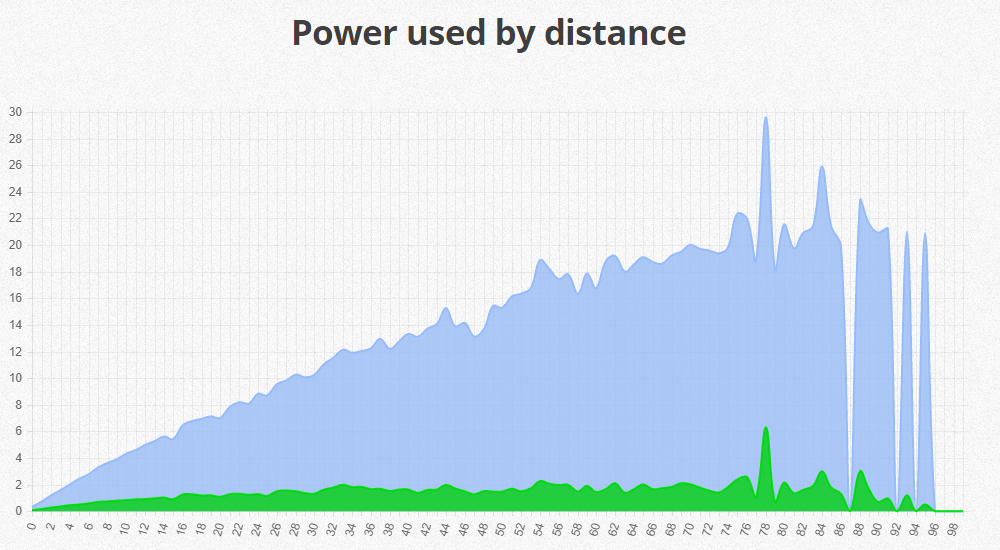
The x axis is showing the length of the trips and the y axis is showing the average amount of kWh used for trips of that length. The green overlay shows the amount of power (in kWh) that was recovered by regenerative braking.
As you'd expect the longer the trip is the more power is used. It's also interesting to see the decreasing value of regenerative braking as the length of a trip increases. As I mentioned above this is probably due to longer trips having much less braking involved.
The length of an EV journey
Something that I constantly get asked about is the range of my car and if that's a limitation. It's probably the number one concern on people's mind when they're thinking of buying an EV. To see if that translates into real world numbers, let's take a look at how long trips are when driving an EV.
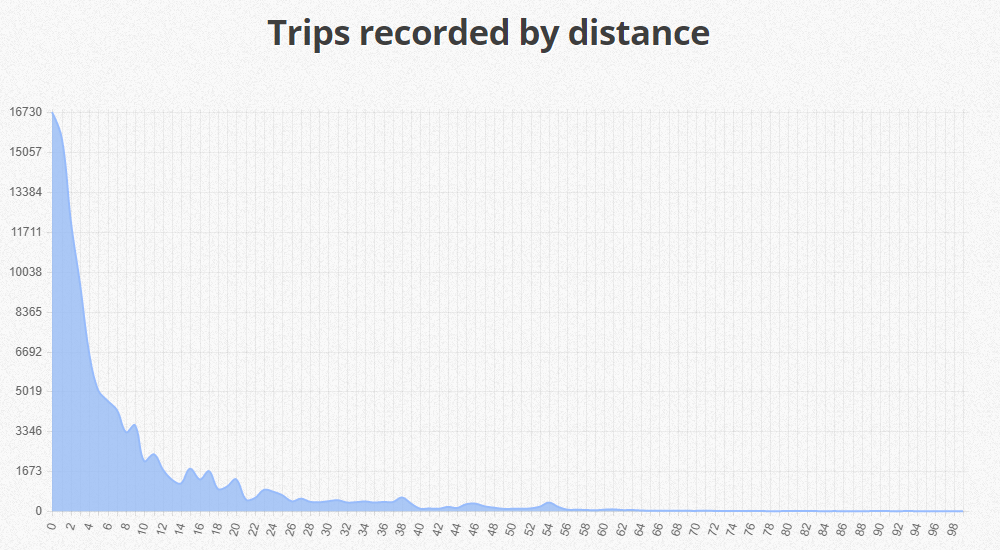
As you can see the absolute vast majority of trips don't even manage to exceed 10 miles, never mind challenging the maximum range of the vehicle! Of a total 110,690 trips there were 44,398 that were 3 miles or less in length, that's over 40%! Whilst it seems that range is a common question or cause for concern, many trips simply don't need it. According to the UK Census in 2011 and the RAC in 2013, the average commute distance is between 9 and 10 miles for UK citizens. That should put it well within the range of any EV!
The total distance covered by various trip lengths
Whilst there is a pretty heavy bias towards trips of a shorter length, they account for much less of the total distance covered in an EV. Even with the lower frequency of longer trips, their larger distance evens out the balance a little.
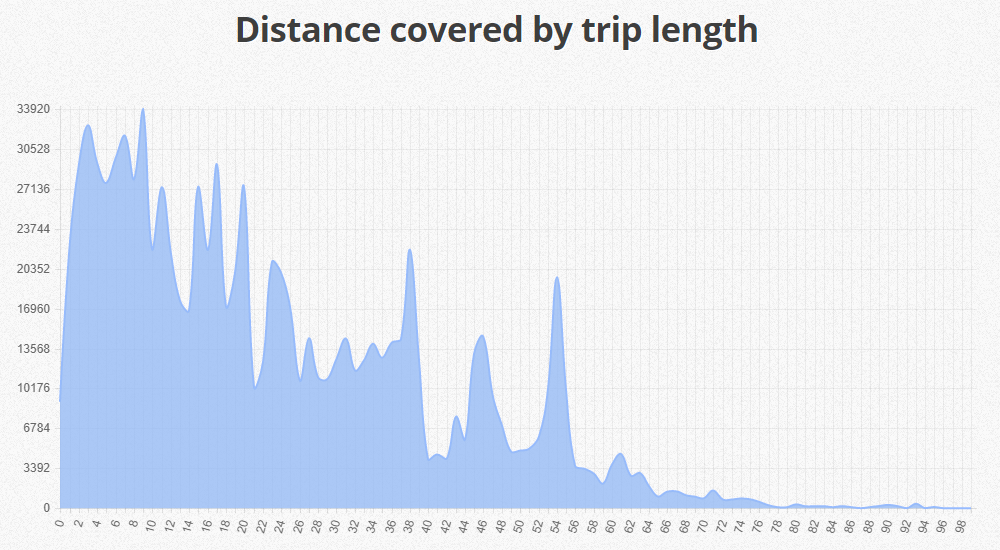
The x axis is showing the trip length and the y axis is showing the total distance covered by trips of that length. Whilst trips of up to 10 miles in length do account for a large portion of the total miles covered, there are a couple of large chunks covered in the 20-40 mile range and 40-60 mile range too, common commute distances between towns and cities in the UK. Whilst EVs are for considerably more smaller trips, they do cover a lot of mileage on longer trips too.
Seasonal variations in efficiency
This might seem like an odd point for anyone that doesn't drive an EV but for someone that does, you will already know exactly what's coming. The external temperature does have a fairly significant impact on the range of an EV and that happens for a variety of reasons.
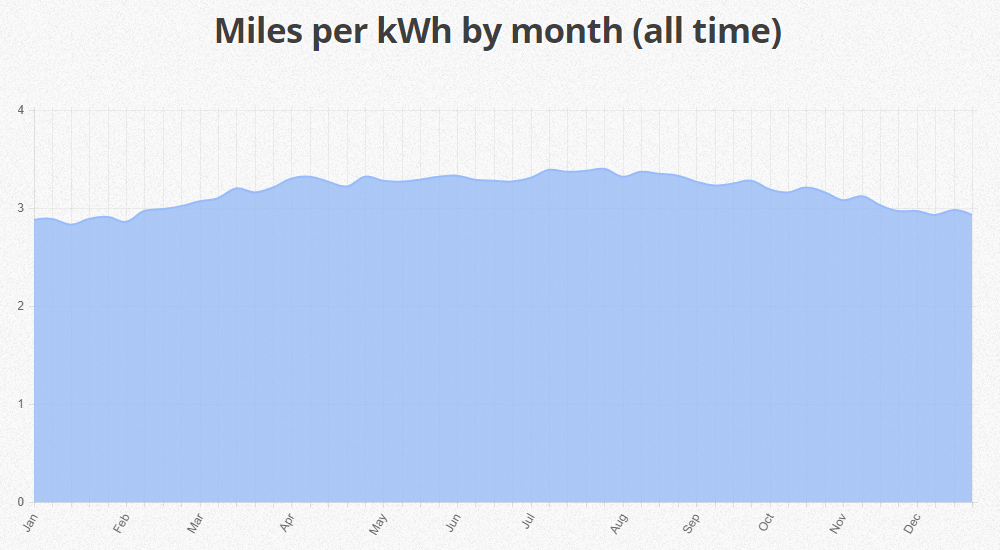
The x axis of this graphs shows the month of the year and the y axis shows the average economy achieved in miles/kWh. What you're seeing here is the various seasons in the UK, from the depths of winter to the height of summer, having a direct and measurable impact on the efficiency of an EV.
In the winter months an EV takes a hit on efficiency for a few reasons. Number one is that the batteries just don't like being cold and perform slightly worse when the external temperature drops, especially below 0c. The other reason is that we, as humans, like to keep warm whilst we're driving. Combustion engines produce staggering amounts of heat as a waste product and that can be used to warm the cabin for 'free'. In contrast to a combustion engine an EV produces basically no waste heat which means it has to consume extra power to generate heat, especially so in winter. The lowest figures for efficiency are in the middle of January when only 2.83m/kWh was achieved and the highest was 3.4m/kWh which was achieved in July. To really drive the point home we can look at the average temperatures in England.

The average maximum temperature in January is only 6.9c with an average maximum temperature in July of 20.9c, respectively the coldest and warmest months of the year. That means that drivers are seeing an average of a 1.2% decrease in efficiency of their vehicle for every 1c decrease in temperature. Not only is it cold and miserable living in England most of the time, it actually costs you more money to drive your car!!
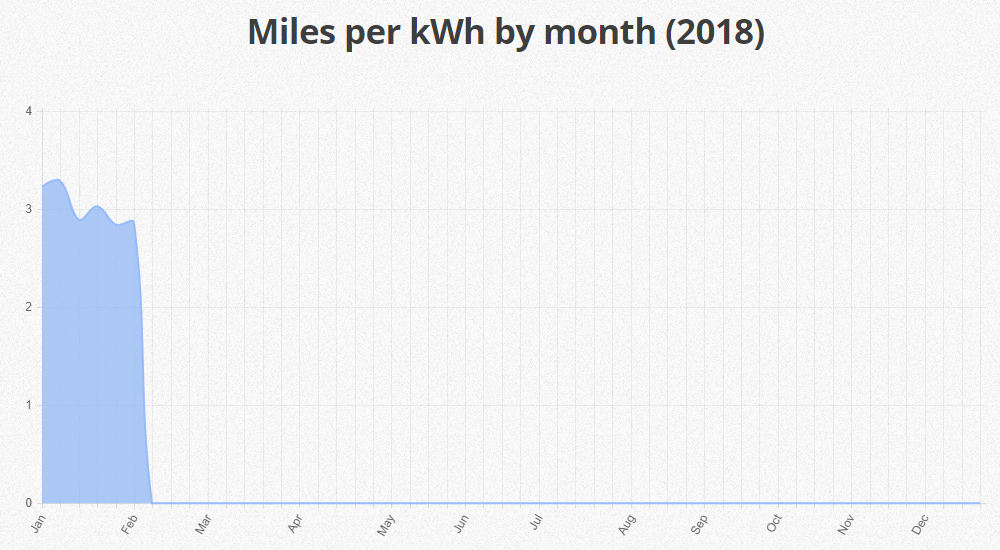
Seasonal variations year by year
The figures above are the average for the whole data set but we can also break it down by each year that we have data for. That means we can go all the way back to 2013 and look at the variations each year to monitor the impact of climate change!*
*not really!
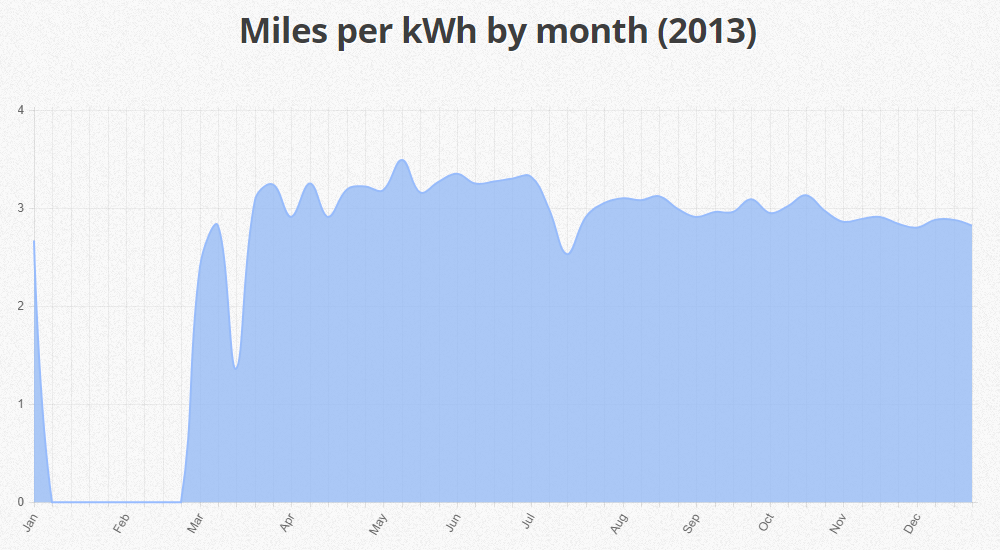
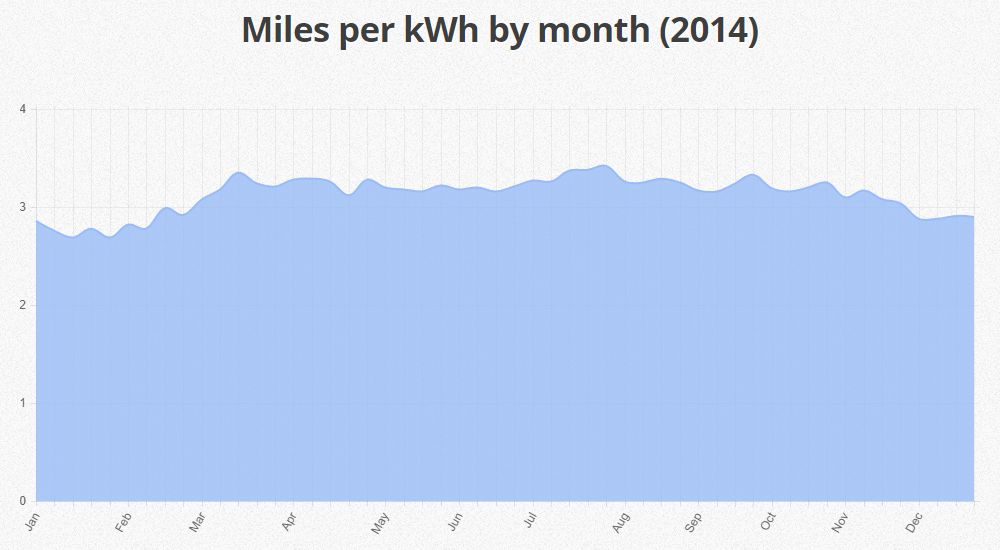
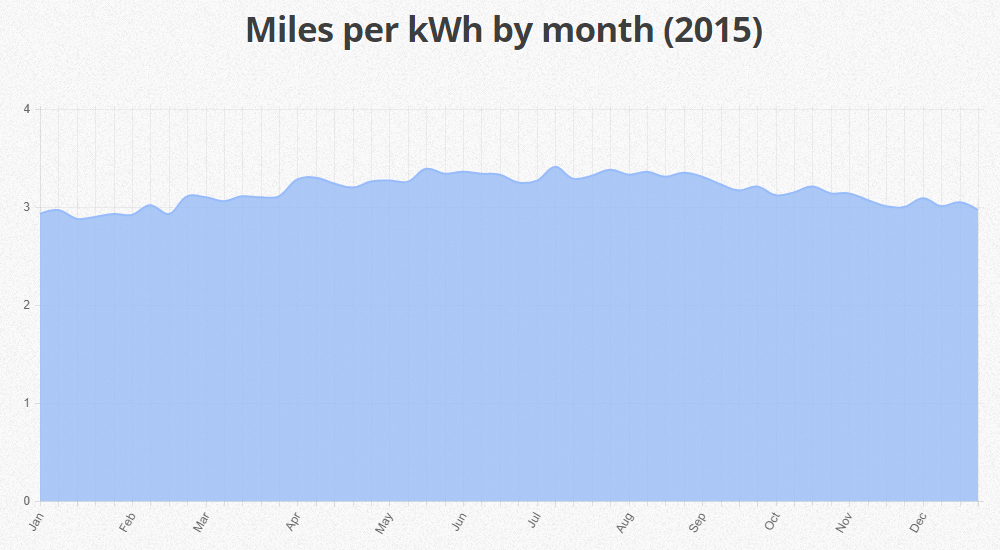
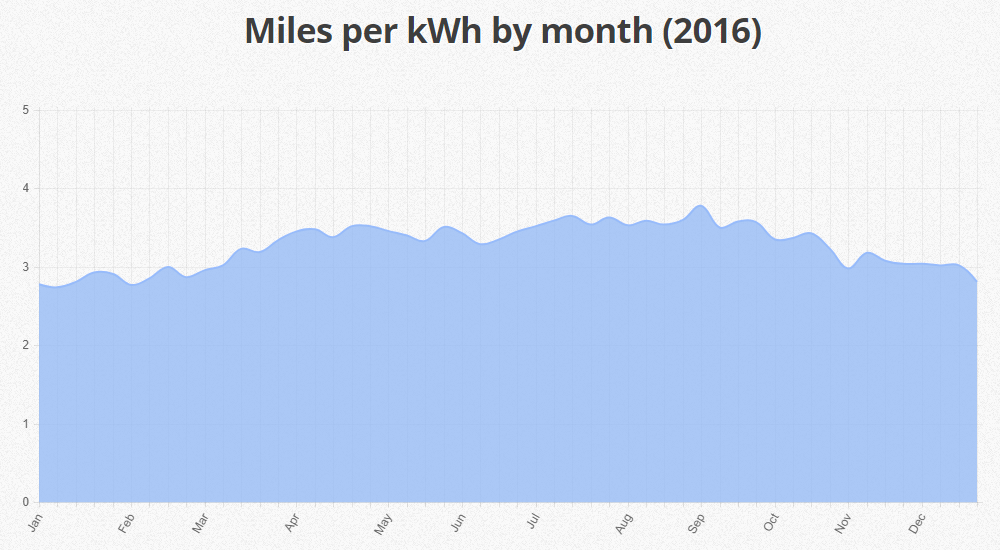
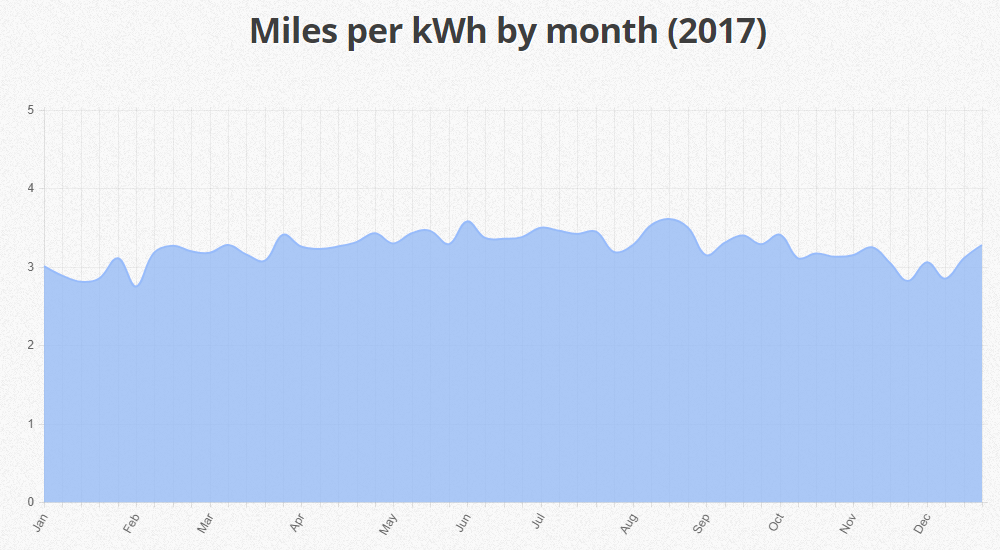
Whilst there is a little variation across the years there's always one trend that remains clear. It's a lot more efficient to drive an EV in summer than it is in winter!
Overall
The numbers do look pretty good and there are some interesting trends in there for sure. Looking at the total data there are just a few more things we can determine too.
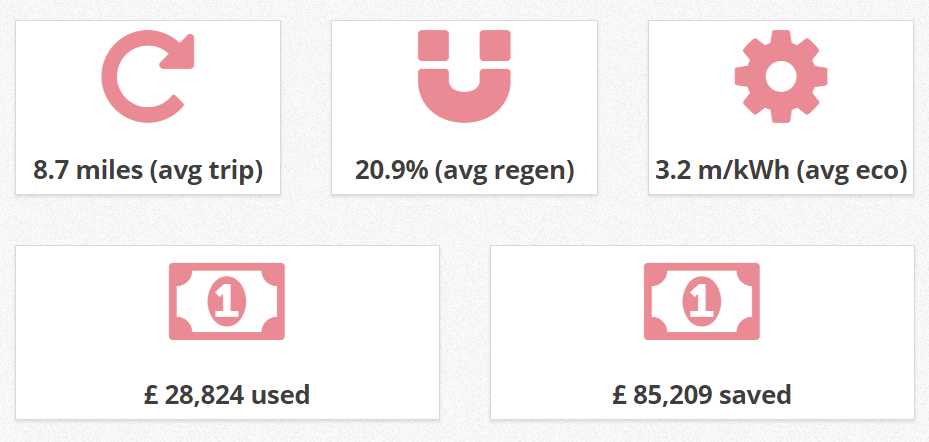
The average journey being only 8.7m is pretty low and a staggering 21% of the energy consumed by an EV is recovered through regeneration with an average economy of 3.2m/kWh achieved. Depending on the cost for electricity where you are, that could represent some pretty cheap driving. In the UK I've been paying roughly £0.13/kWh for the last few years but it is available much cheaper too. If you have an Economy 7 tariff you can charge your car overnight when electric is as cheap as £0.07/kWh. This can of course be offset even further by solar or any other form of self generated power.
The other thing that Nissan provide is the amount of CO2 saved by using an EV instead of an average petrol/diesel car. The figures above give us the following, impressive, numbers.

All in all, that's not bad going and I bet these numbers will only get bigger and better as EVs continue to be developed and sold in increasing numbers.