
It's been a long time since the last one of these! The previous Top 1 Million Analysis was way back in June 2022, and a lot has happened since then. But there's a much bigger reason to dust off the crawler and publish another report: this year marks ten years since I started crawling the top 1 million sites! The very first crawl went out in 2016, and a decade later it feels like exactly the right moment to take stock of how far web security has come — and where it's quietly going backwards.
There's so much to cover this year that I've split the report into two parts. This first part is the anniversary retrospective and the broad state of the web — HTTPS, the security headers, cookies, email and DNS security, and more. Part two is going to be a dedicated deep-dive into the cryptography side of things with TLS, certificates, certificate lifetimes, the arrival of post-quantum cryptography, and more. That will be published tomorrow.
Introduction
Over a decade ago, I started measuring how the web was adopting some of the security features that were, at the time, still relatively new or uncommon. Things like HTTPS redirects, HSTS, CSP, security headers, cookie flags, and other browser-side protections were gradually becoming part of the modern web security toolkit. A decade later, the picture looks very different. Some of those technologies are now firmly established, others have struggled to gain meaningful adoption, and in many cases the presence of a feature doesn’t necessarily mean it has been deployed well. In this post, I’m taking a fresh look at the Tranco Top 1 Million to see how far we’ve come, where progress has stalled, and what the current state of web security really looks like.
The Crawl
The methodology is the same as it's always been: take the Tranco Top 1 Million list, request each site over HTTP, follow the redirects, and record everything about the response — security headers, the TLS handshake, the certificate, a bunch of DNS lookups, and everything else I could think of. Of the million sites on the list, 819,002 responded this time, and everything below is measured against that responding population.
Two things worth flagging up front. First, the gap: four years is a long time (my bad), so where it's useful I've compared back to June 2022, but I've also leaned on the full historical dataset for the ten-year view. Second, I took the opportunity to substantially expand what the crawler measures for this anniversary edition — there are a whole set of new metrics here that have never appeared in one of these reports before (cookie security attributes, DMARC/SPF, cross-origin isolation, ECH, post-quantum cryptography and more). More on those as we go, and the big hitters will be in part two.
A decade in numbers
Before we dig into individual metrics, here's the headline story of ten years of web security, told through the three metrics with the longest history:
| Metric | Aug 2015 | Mar 2020 | Jun 2022 | Jun 2026 |
|---|---|---|---|---|
| Redirect to HTTPS | 62,043 | 528,498 | 589,979 | 658,038 |
| HSTS | 11,308 | 132,466 | 188,492 | 252,846 |
| CSP | 1,365 | 51,986 | 79,549 | 170,057 |
That's the encouraging part — the foundational stuff is still climbing. HTTPS has gone from a minority of sites to the overwhelming default, HSTS continues its steady climb, and CSP has more than doubled again since 2022. The web really is more secure than it was a decade ago. But as we'll see, several of the metrics I've tracked for years have plateaued or started to slide, and the most interesting story this year is in the brand-new things that didn't even exist last time.
The biggest movers of the decade
Ten years is long enough to see some genuinely enormous swings. Measured from the very first crawl in 2015, the biggest risers are:
| Metric | Aug 2015 | Jun 2026 | Change |
|---|---|---|---|
| Content-Security-Policy | 1,365 | 170,057 | +12,360% |
| CSP-Report-Only | 211 | 9,979 | +4,630% |
| HSTS | 11,308 | 252,846 | +2,140% |
| Redirect to HTTPS | 62,043 | 658,038 | +960% |
| X-Content-Type-Options | 44,315 | 311,659 | +603% |
| X-Frame-Options | 55,042 | 327,918 | +496% |
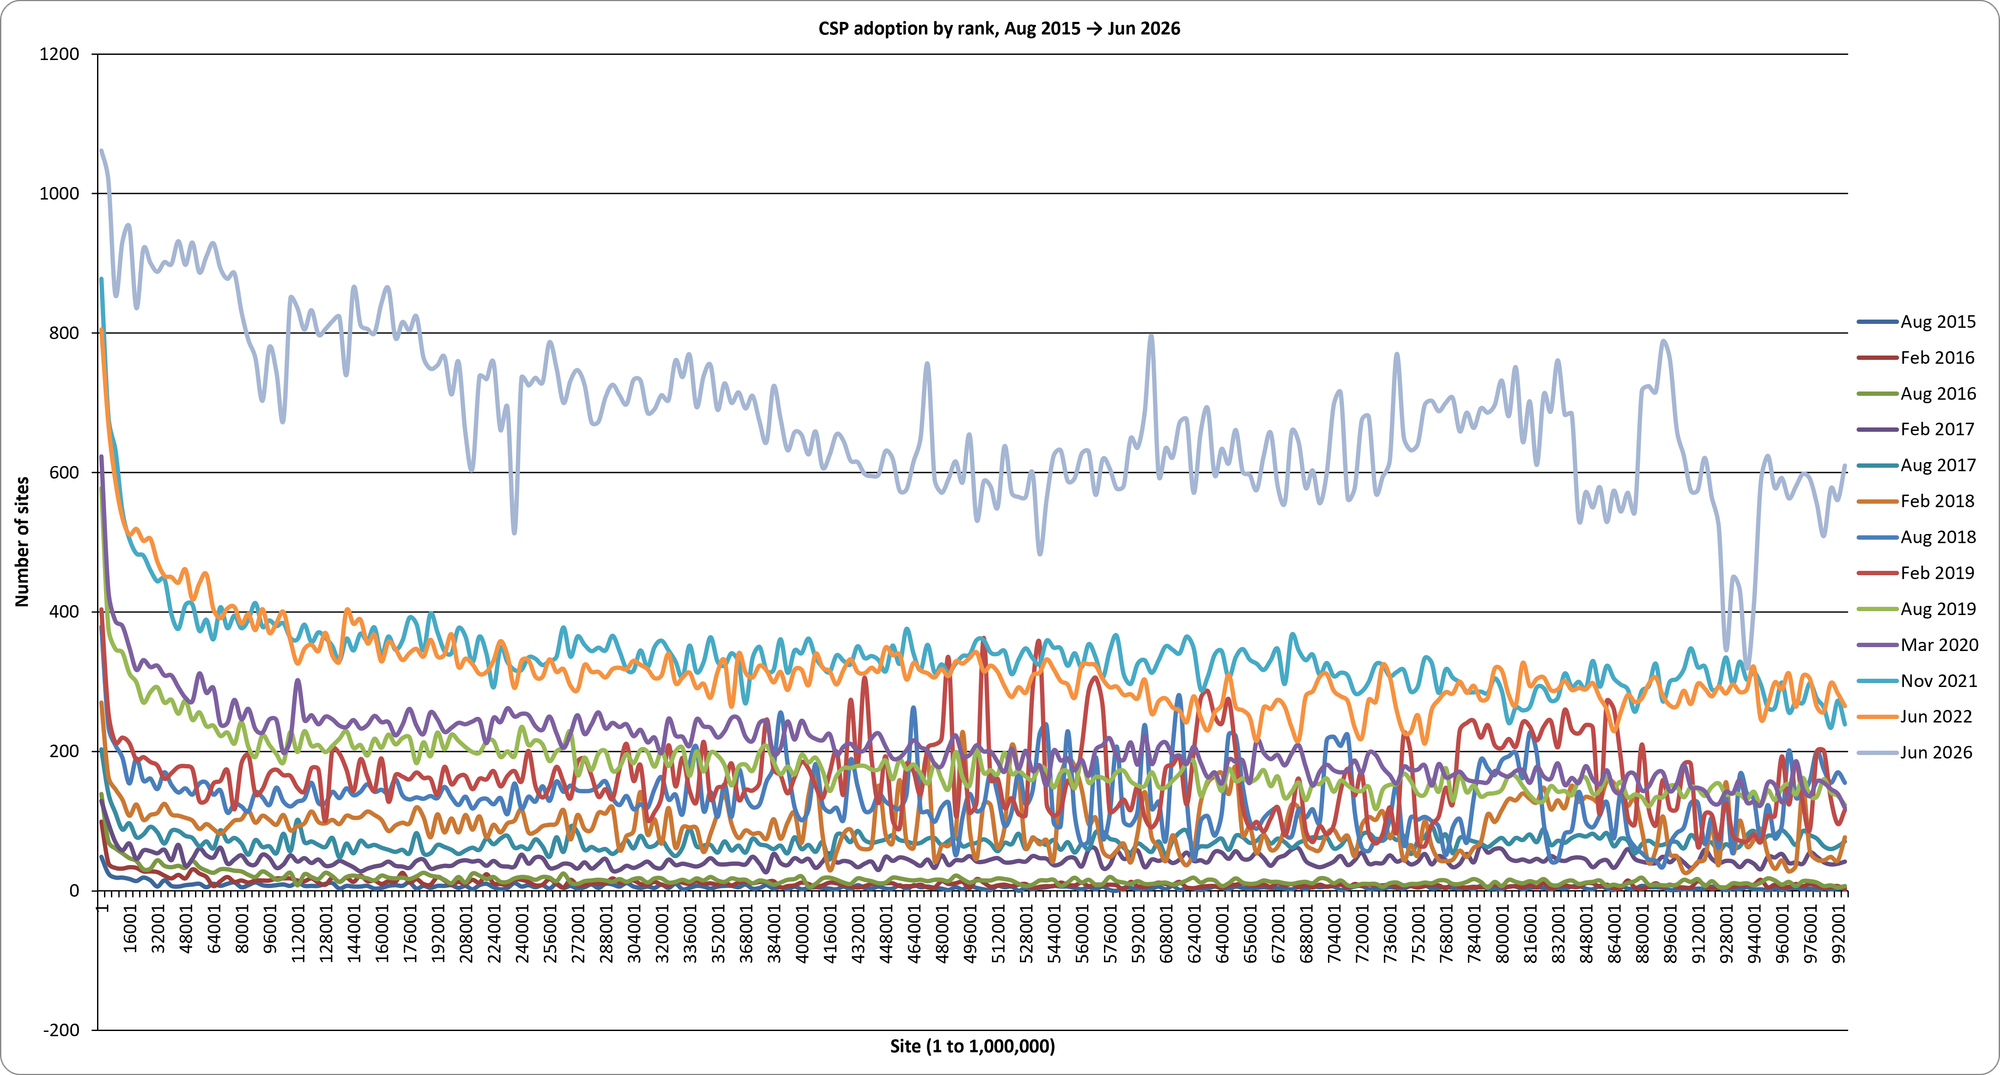
CSP going from barely a thousand sites to 170,000+ — a 125× increase — is the standout of the decade, without a doubt. It's great to see it finally getting the attention it deserves.
And the notable fallers and reversals, mostly more recent:
EV certificates: 15,604 (2020 peak) → 4,186, a slow-motion collapse. If you're new to the Web, you may not have seen an EV certificate in action as their UI was removed back in 2019 (Gone forEVer) and I've been tracking their decline since long before that (Sites that used to have EV). It's weird to see that EV is still most popular in the highest ranked sites, I guess they have the money to burn?
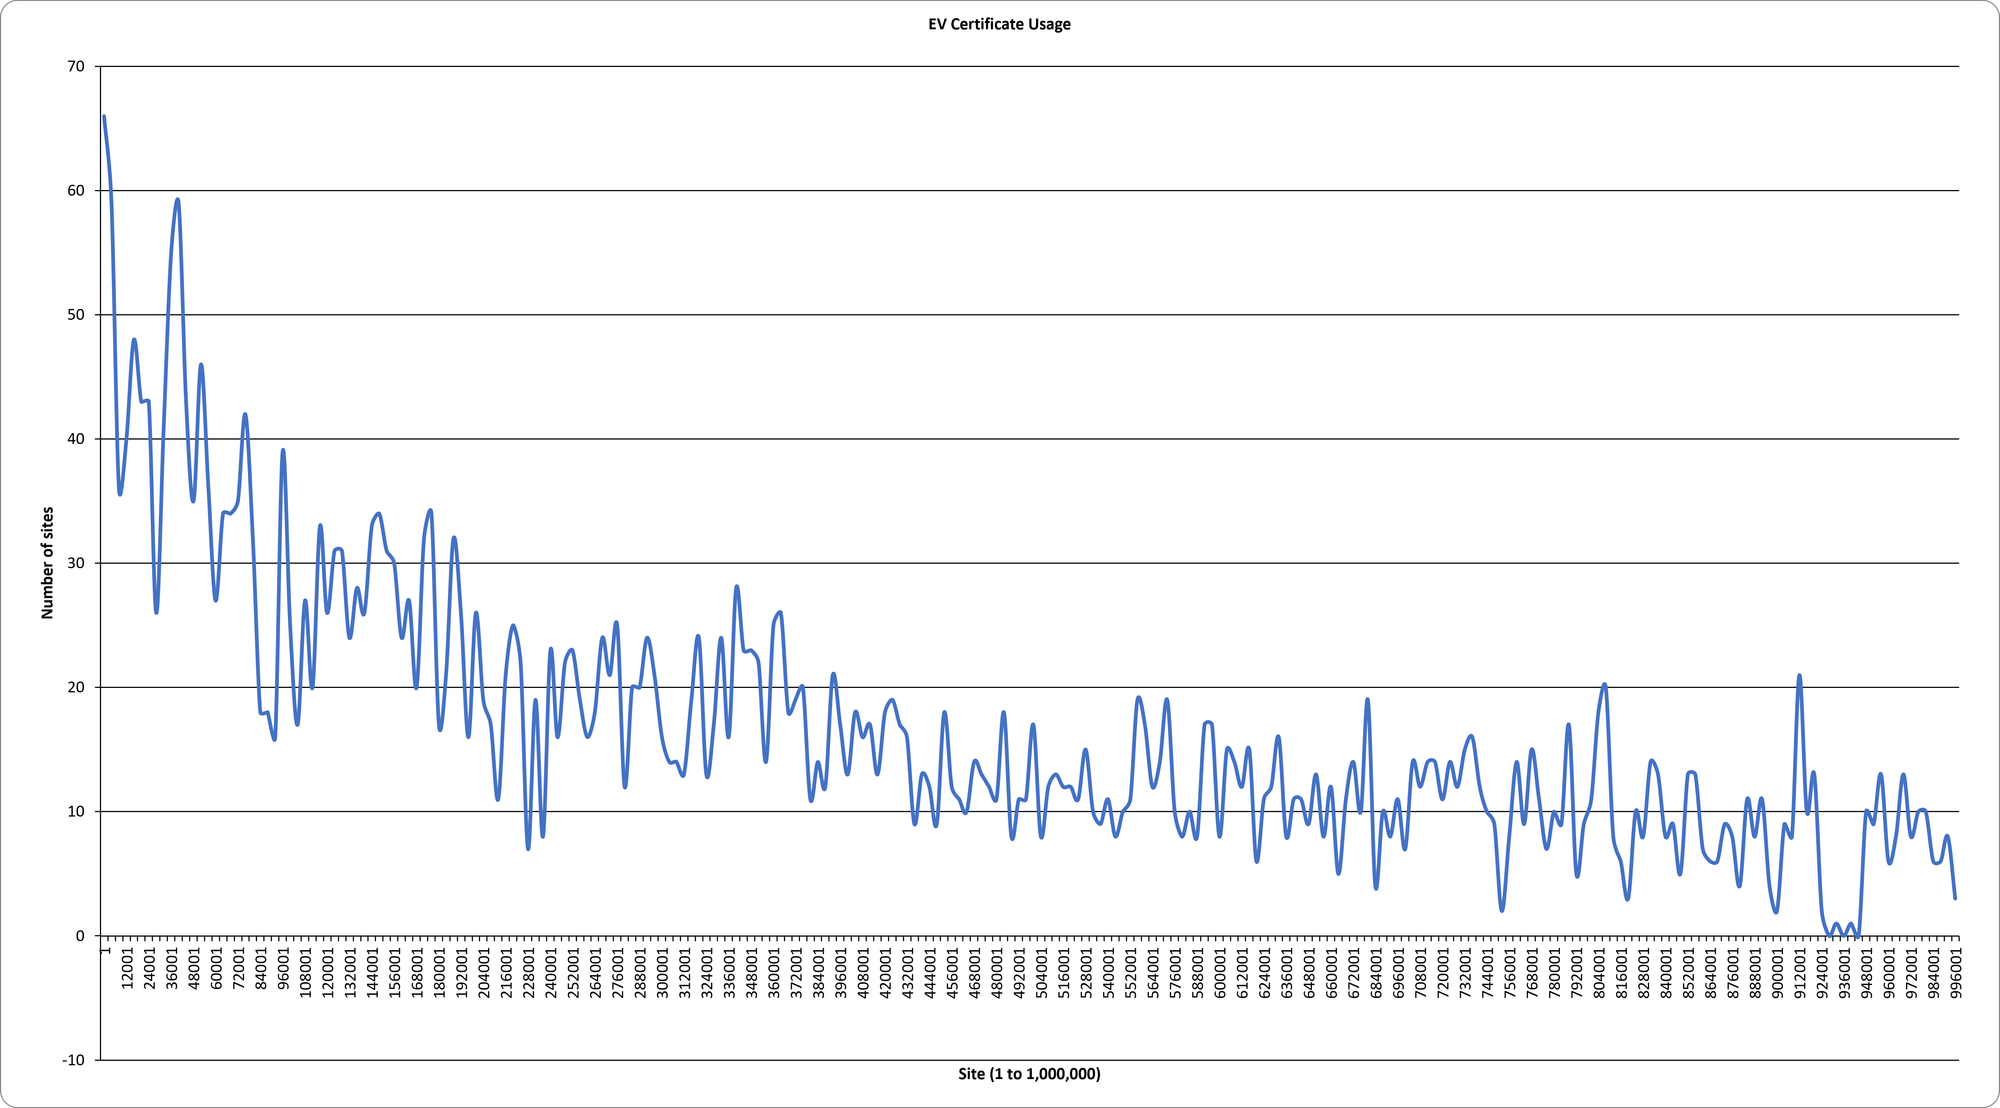
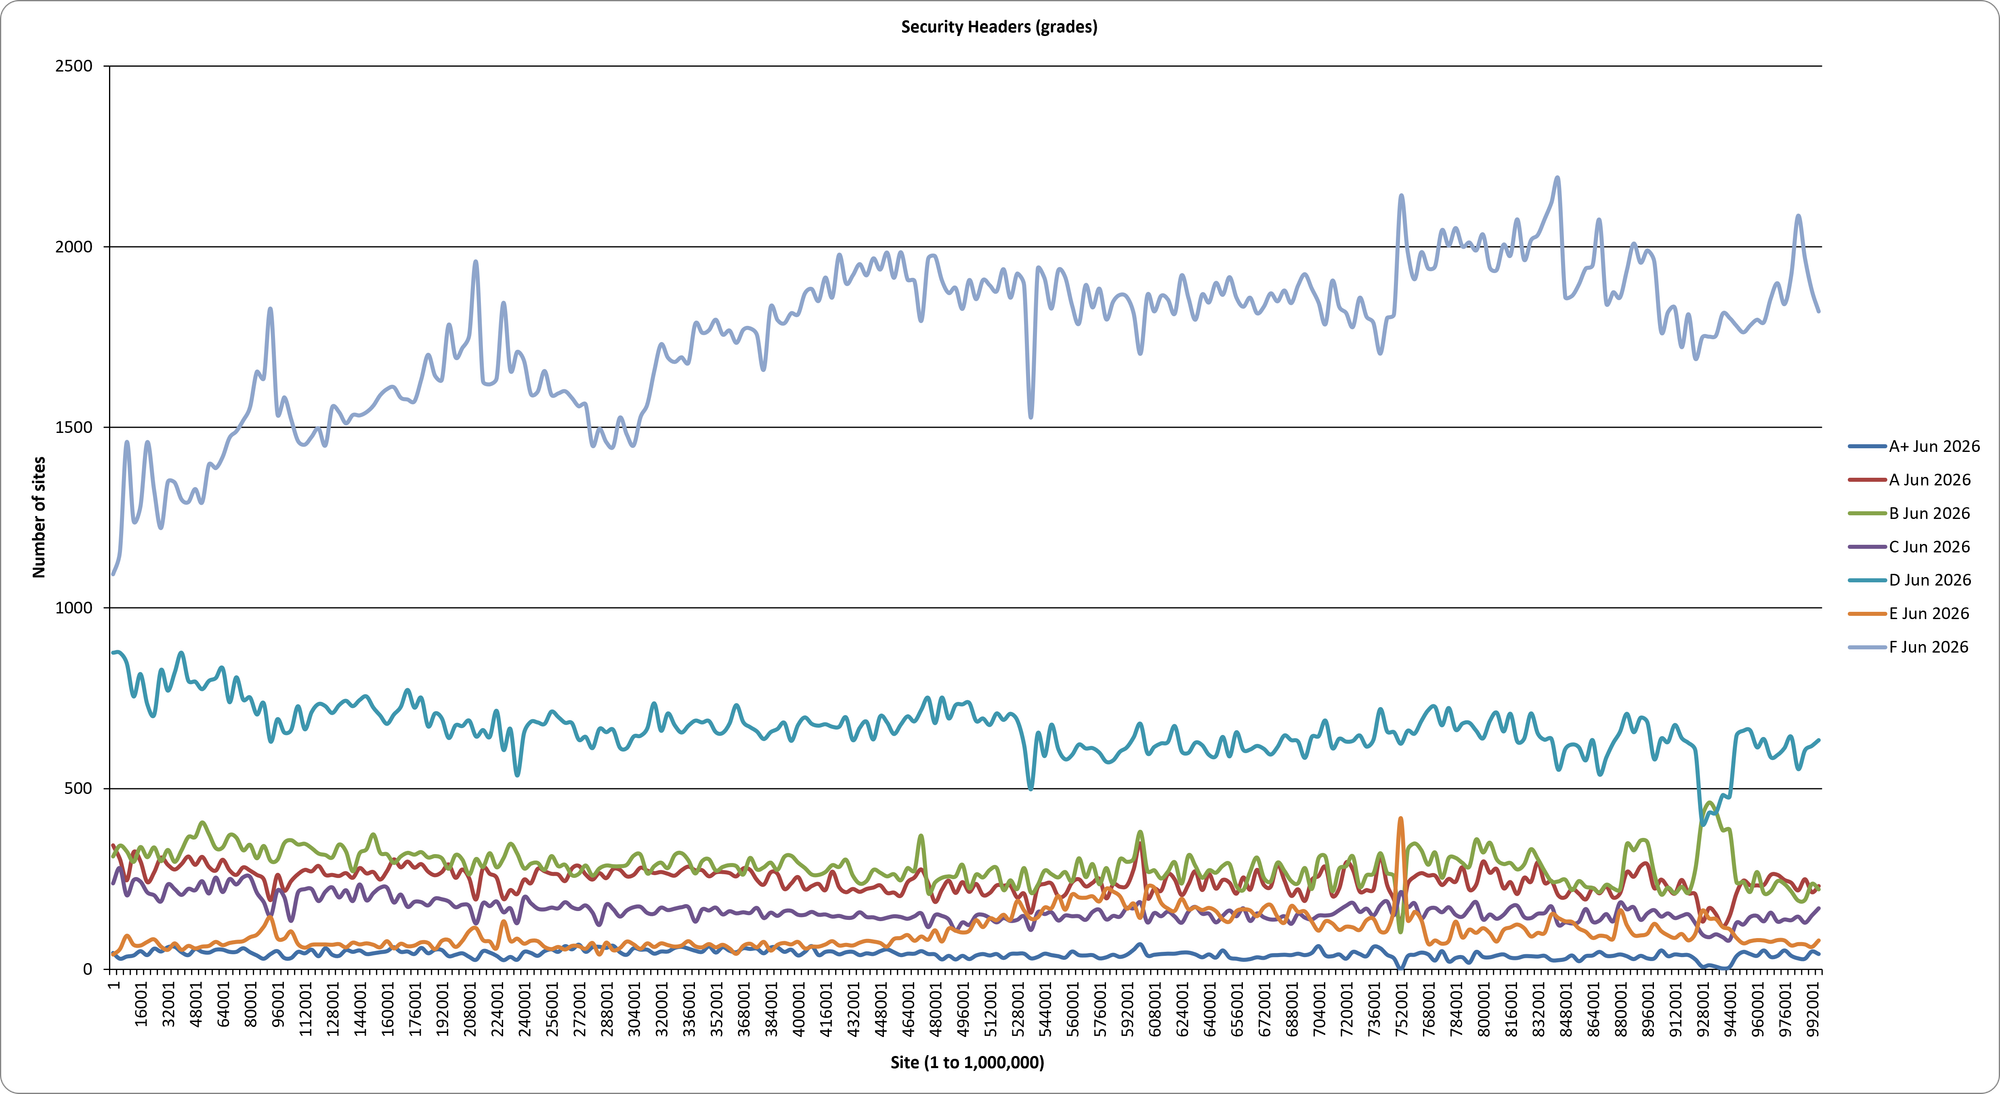
A quick note if you've not read one of these crawler reports before, this is the typical form I present the graphs in. We have the top 1 million sites on the x-axis, in groups of 5,000 sites, and the y-axis shows how many sites in that group have the feature.
Feature-Policy: peaked and now declining as Permissions-Policy replaces it, this decline is a good thing as sites are responding to the changing standards.
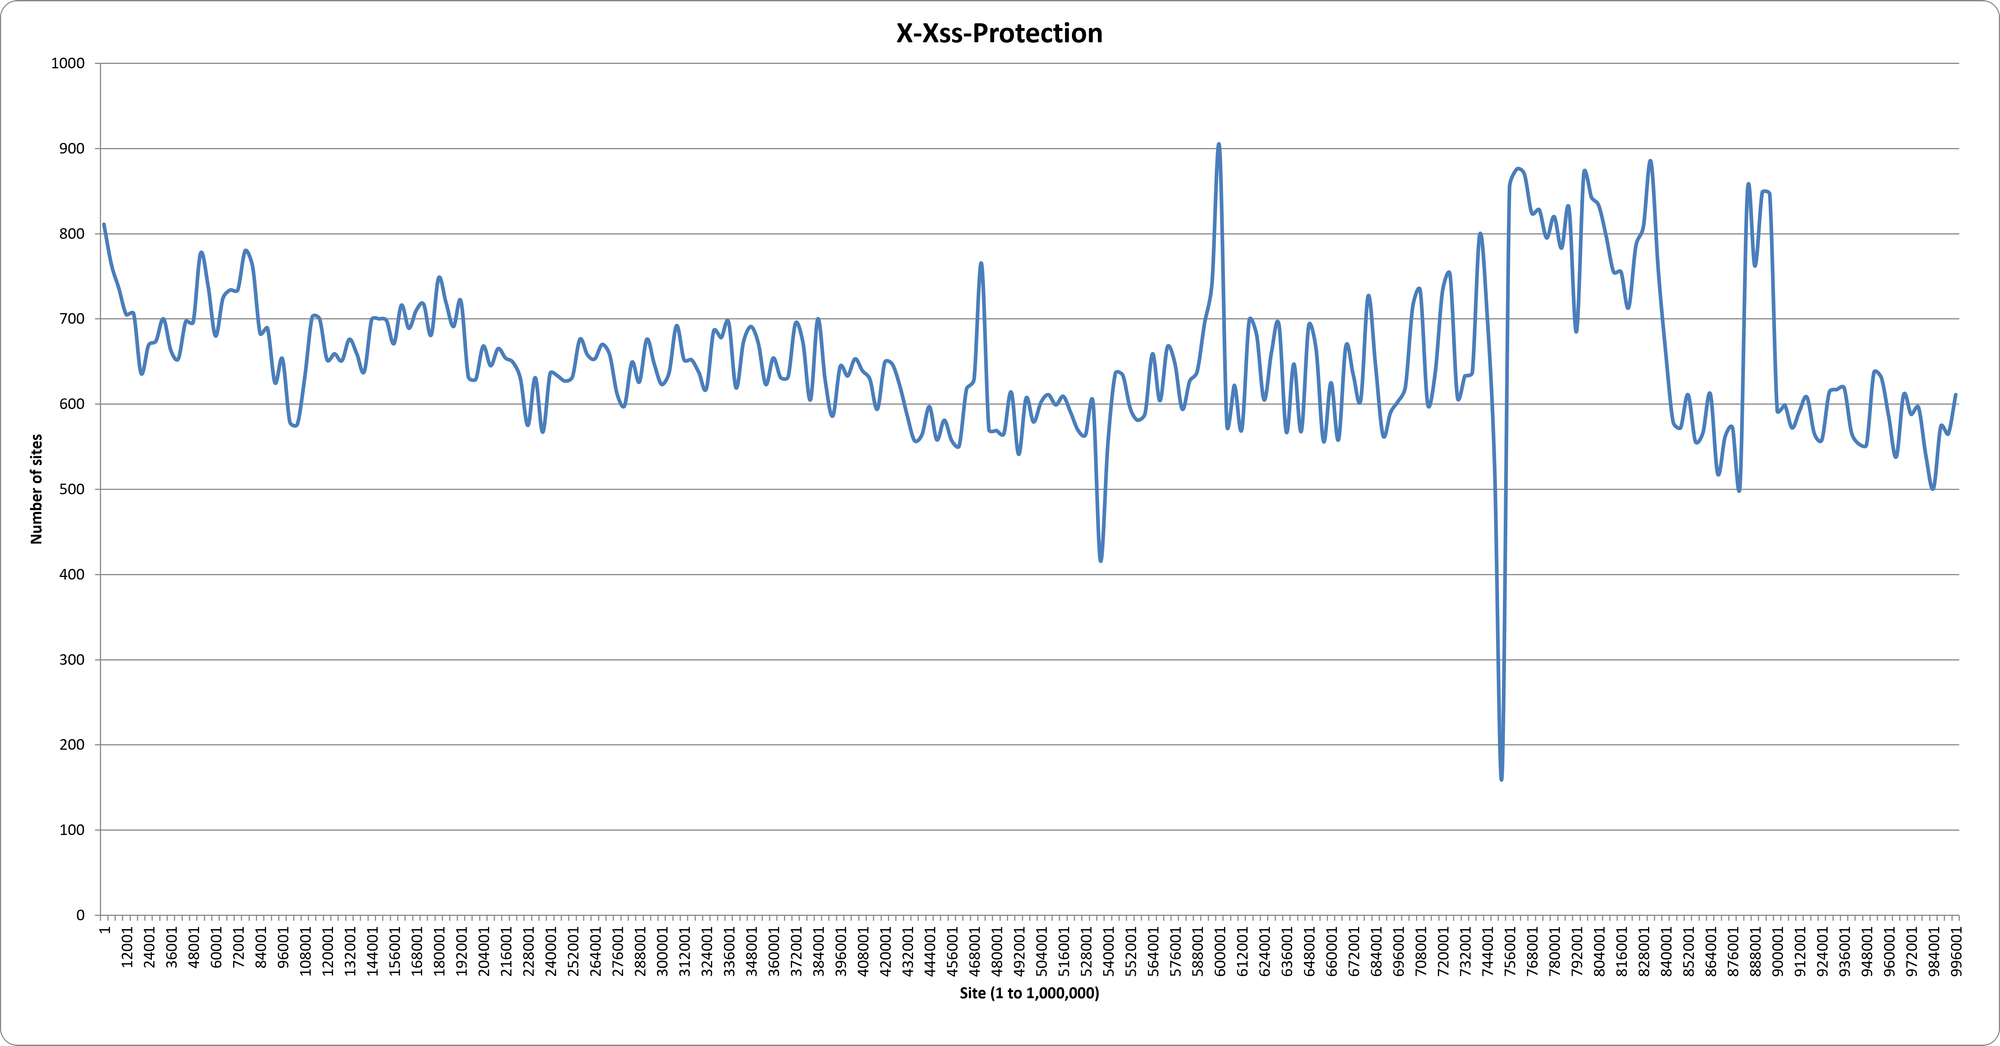
X-XSS-Protection grew ~290% over the decade, to 163,114 sites. How odd. For a feature browsers have since removed entirely, it's doing spectacularly well...
HTTPS
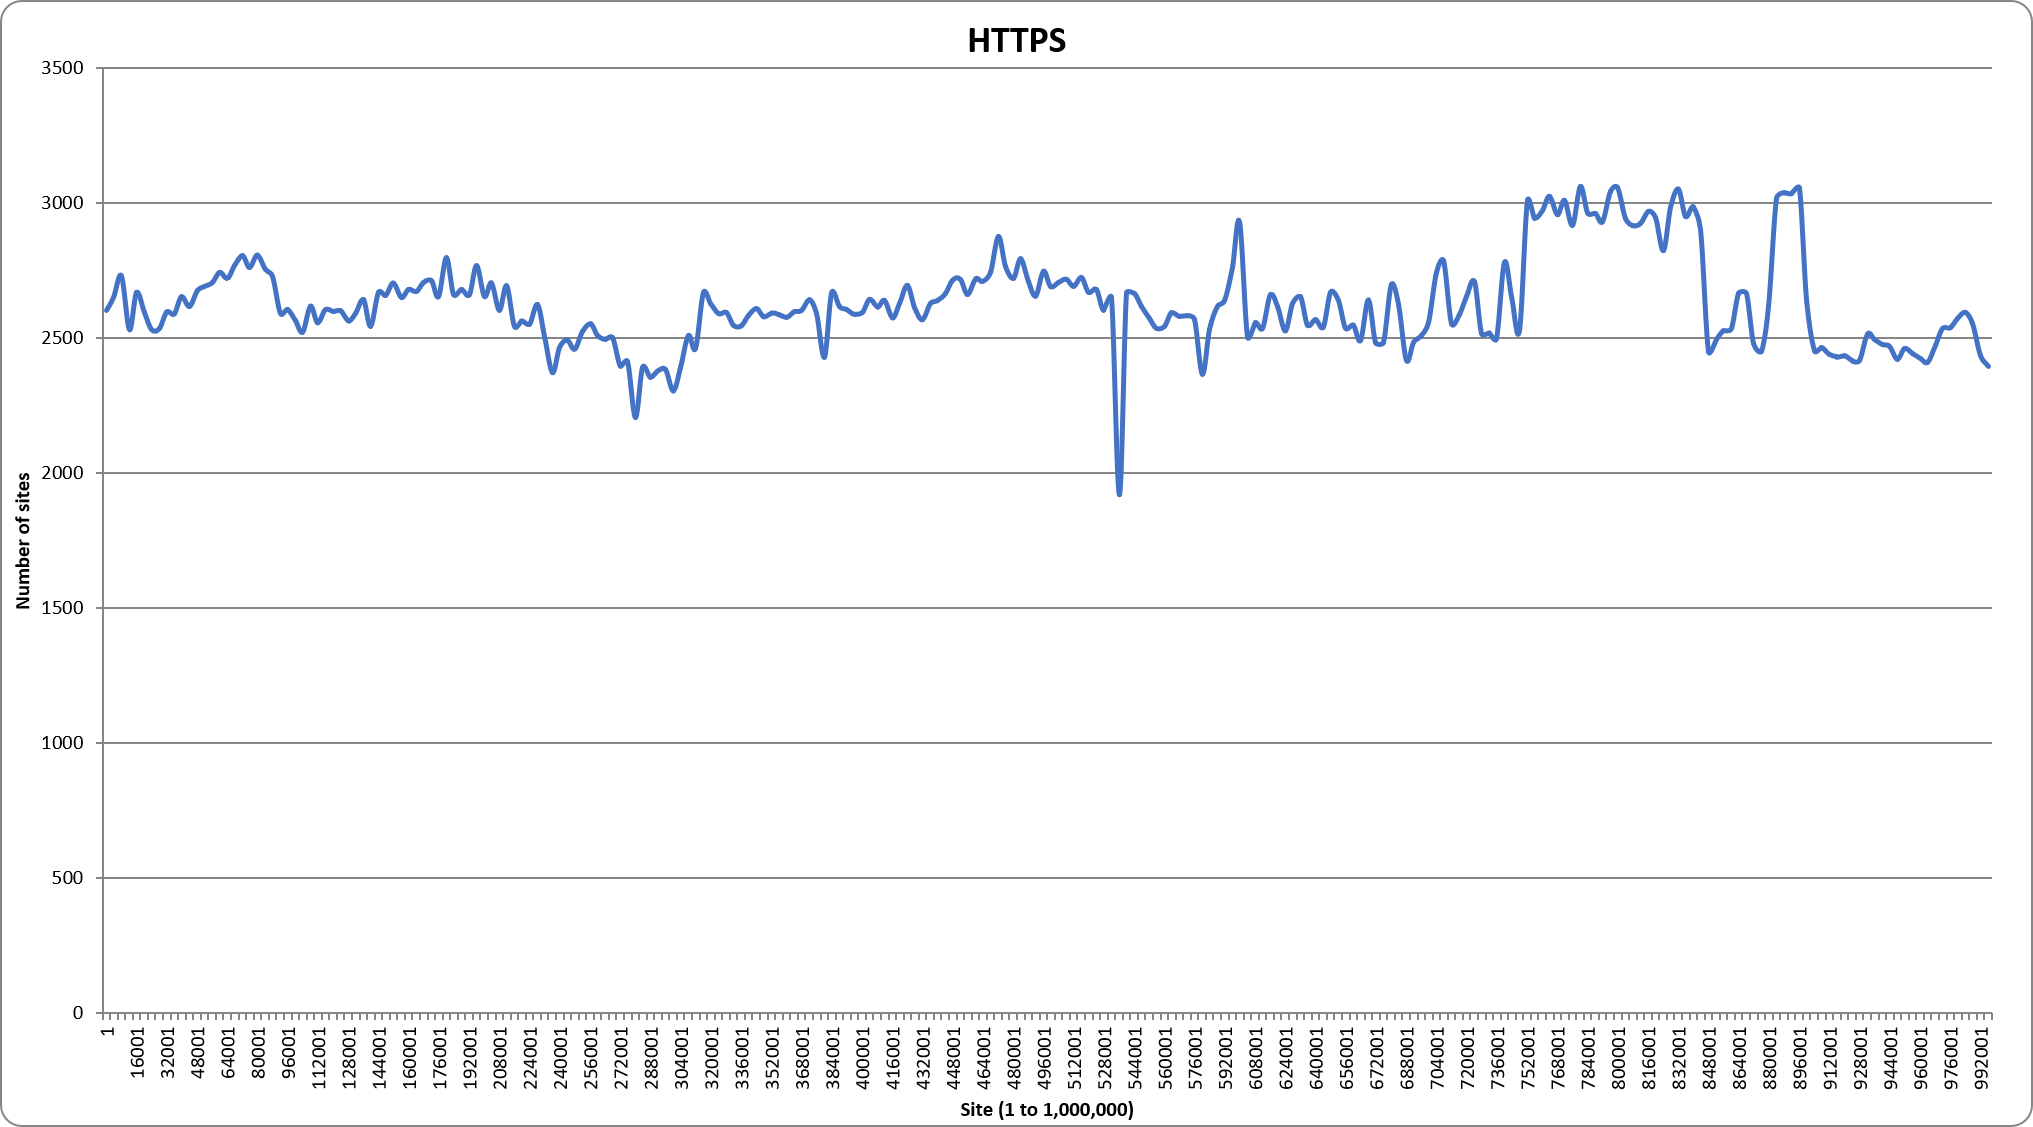
658,038 sites now redirect to HTTPS, up about 12% from 589,979 in 2022. To put the ten-year arc in perspective, that figure was just 62,043 in 2015 — under 7% of the responding sites. HTTPS is now simply how the web works, and the long tail of plain-HTTP sites is shrinking every year. If you're somehow still in that tail, we have an excellent two-day course to get hands on with deploying HTTPS that you can check out: Practical TLS and PKI. Here's the current state of HTTPS in the top 1 million sites.
Next, let's take a look at HTTPS adoption over the years.
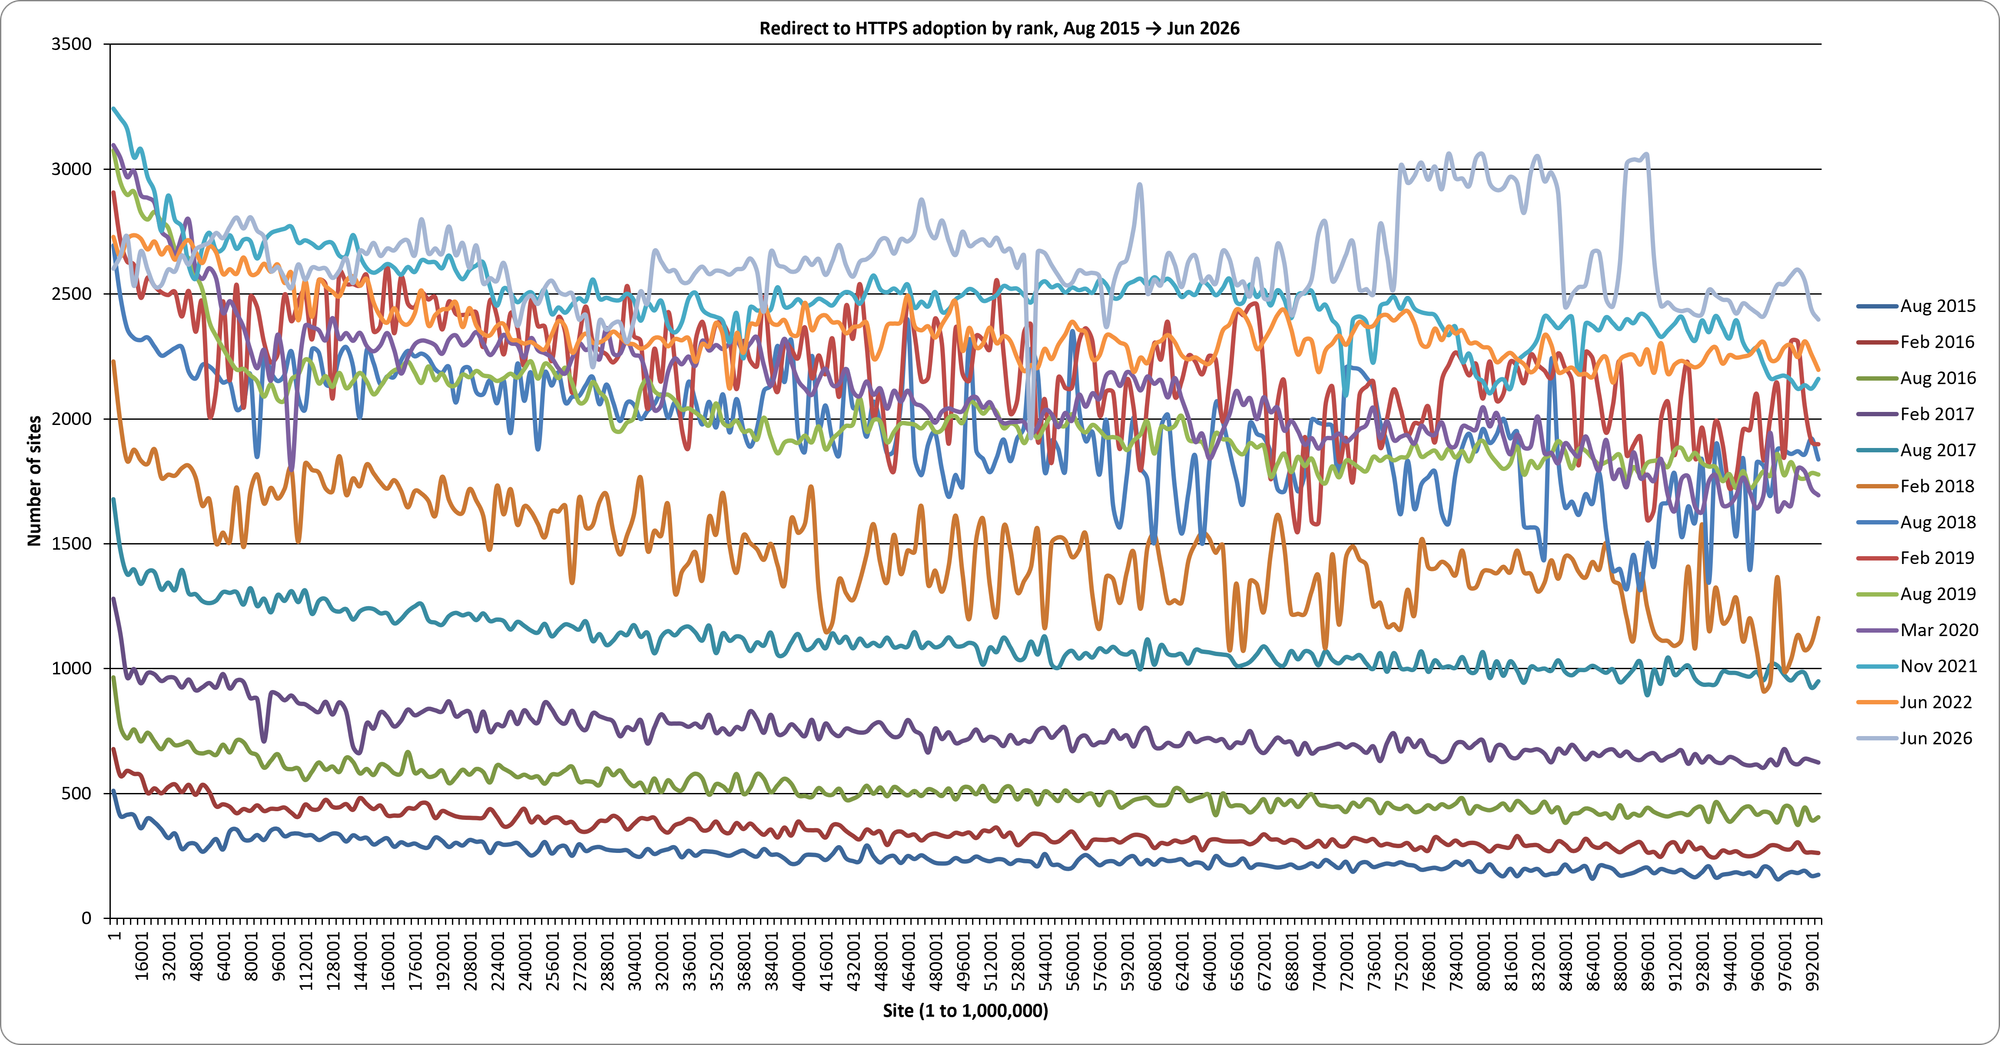
Just look at that rise in adoption! You can also see another similar trend in that sites at the higher end of the ranking (the left side of the graph) are more likely to deploy certain security measures like HTTPS and sites further down the ranking (the right side of the graph) are less likely.
HTTP Strict Transport Security
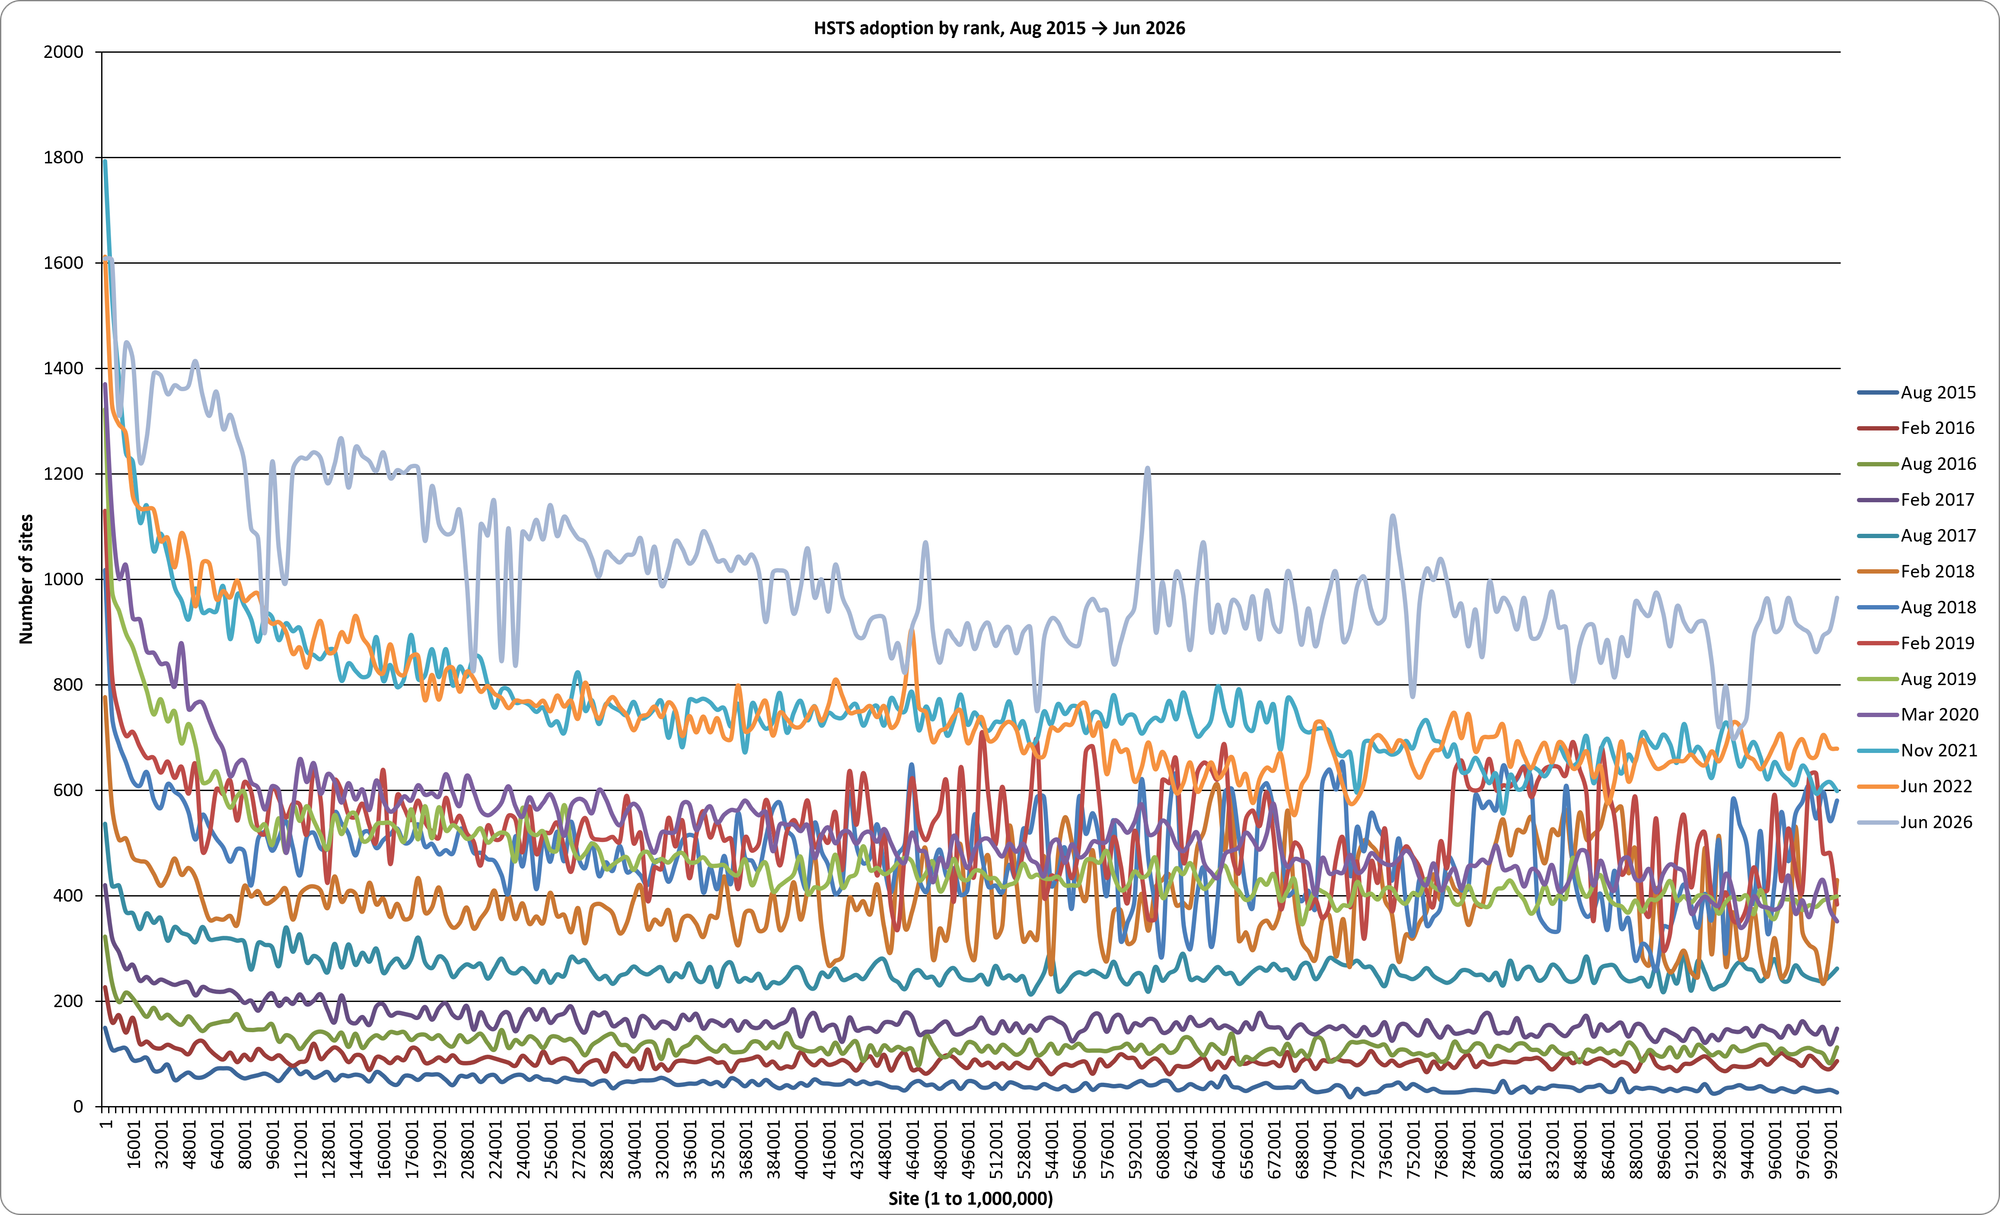
HSTS continues its healthy growth: 252,846 sites now send the header, up 34% on 2022. Given that HSTS only makes sense once you're fully on HTTPS, it's reassuring to see it keep climbing rather than plateauing alongside HTTPS.
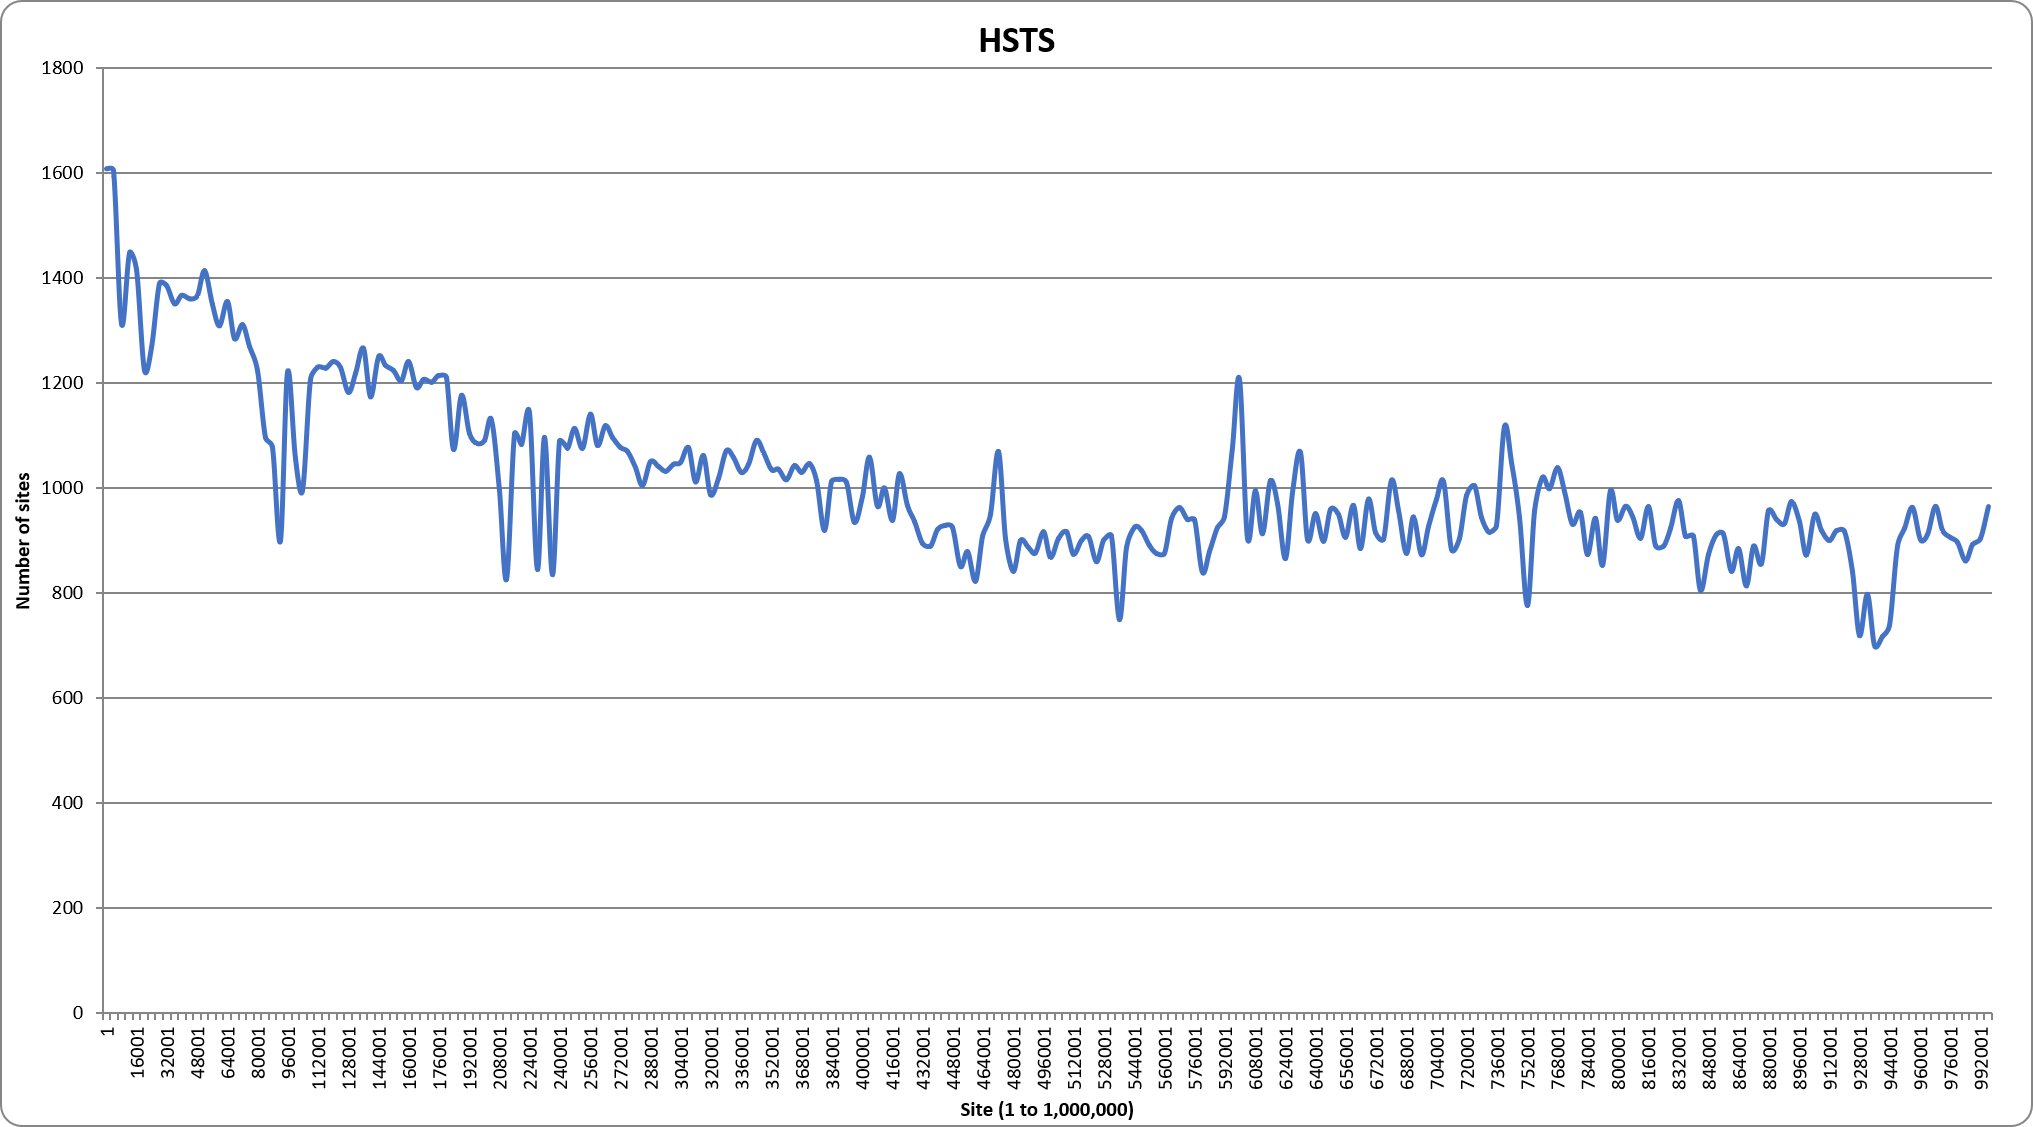
HSTS has shown huge growth over the last 10 years and now stands out as a very popular security mechanism.
But presence isn't the same as a good configuration. Looking at how those sites actually set the header: only 49.8% include includeSubDomains, 69.2% set a max-age of at least a year, and 29.2% send the preload directive — but when you require all three together, which is the real bar for the preload list, only 21% (53,019 sites) actually qualify. A lot of HSTS deployments are weaker than they look. If you want to get the directives (and preload) right, the HSTS Cheat Sheet has you covered.
| Configuration | Sites | Share |
|---|---|---|
max-age ≥ 1 year |
174,988 | 69.2% |
includeSubDomains |
125,826 | 49.8% |
preload directive |
73,792 | 29.2% |
| Preload-eligible (all three) | 53,019 | 21.0% |
Security Headers
The core security headers continue to grow, and some of them dramatically. With some really simple and easy wins for security and privacy, it's nice to see continued increases in the numbers.
| Header | Jun 2022 | Jun 2026 | Change |
|---|---|---|---|
| Content-Security-Policy | 79,549 | 170,057 | +114% |
| Referrer-Policy | 70,928 | 229,130 | +223% |
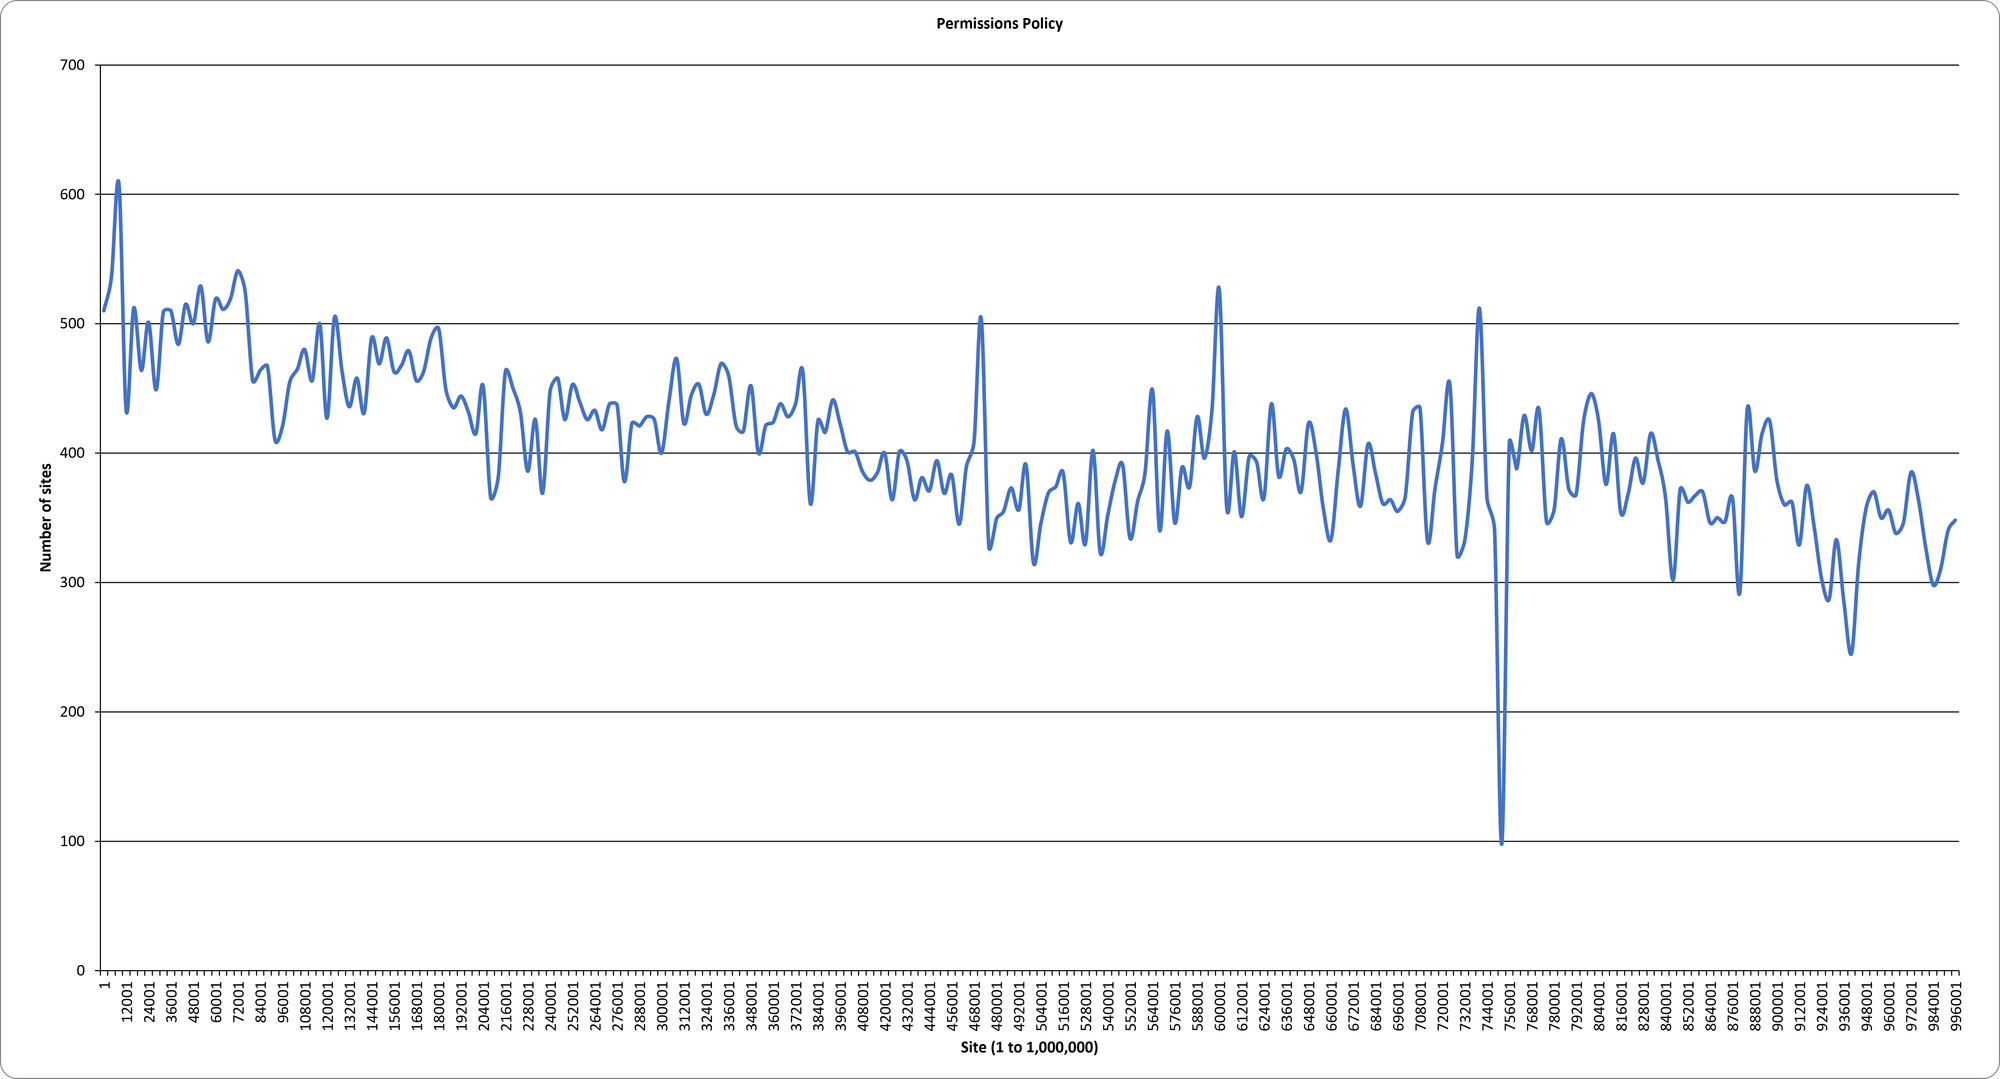
| Permissions-Policy | 32,837 | 101,364 | +209% |
| X-Frame-Options | 201,170 | 327,918 | +63% |
| X-Content-Type-Options | 184,302 | 311,659 | +69% |
Referrer-Policy is the standout, more than tripling — it's cheap, safe, and increasingly set by default by frameworks and CDNs. CSP more than doubling is hugely encouraging given how hard it is to deploy well; if you're wrestling with one, reach out to us at Report URI and we'll make it easy. Permissions-Policy has tripled as it finishes replacing the deprecated Feature-Policy (now down to 4,600 and falling).
One blemish: X-XSS-Protection is still being sent by 163,114 sites and is even still growing slightly, despite browsers having removed the feature entirely. It does nothing now, and in its day it could even introduce vulnerabilities. It's a header that should be deleted, not deployed.
Permissions-Policy, by contrast, is being used sensibly: the most-restricted features are the genuinely sensitive ones — geolocation (80.6%), microphone (79.5%) and camera (79.3%) — with payment, the motion sensors and USB close behind. (A lingering 5.8% still disable interest-cohort, the FLoC opt-out for a feature that no longer exists.)
| Feature | Sites | Share |
|---|---|---|
| geolocation | 81,534 | 80.6% |
| microphone | 80,418 | 79.5% |
| camera | 80,148 | 79.3% |
| payment | 66,674 | 65.9% |
| gyroscope | 63,834 | 63.1% |
| magnetometer | 63,630 | 62.9% |
| usb | 62,608 | 61.9% |
| accelerometer | 61,517 | 60.8% |
| clipboard-write | 51,795 | 51.2% |
| fullscreen | 12,308 | 12.2% |
| autoplay | 7,324 | 7.2% |
| interest-cohort (FLoC, dead) | 5,872 | 5.8% |
CSP: presence vs strength (new)
With a 114% increase since just the last crawler report, CSP has continued to see strong growth.
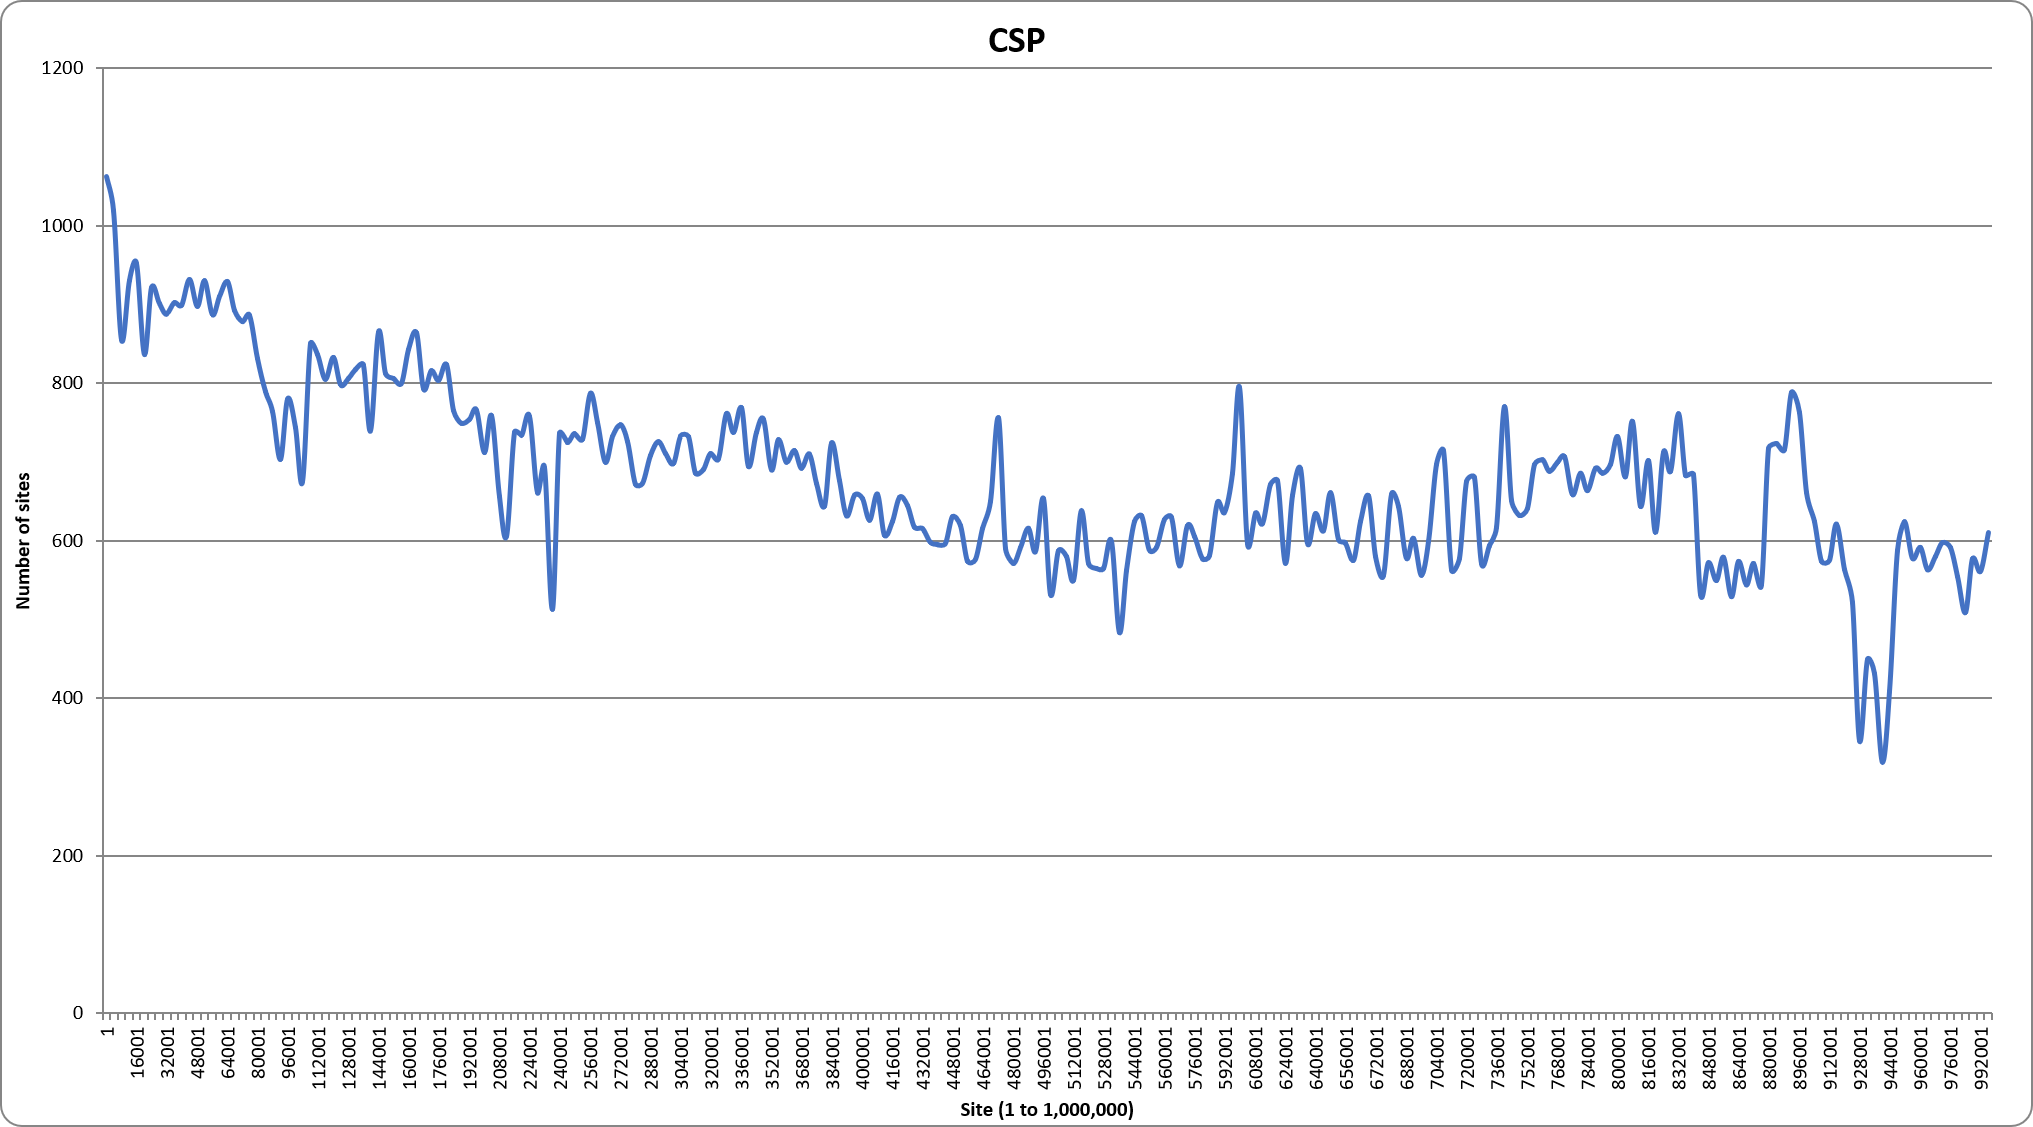
The higher ranked sites to the left are much more likely to deploy a CSP, whilst the lower ranked sites to the right are less likely to deploy a CSP. One of the really key points with CSP is the explosive growth in adoption over the years, made clear when we look at the historic data.
Growth is one thing; strength is another, and CSP is where the gap shows most. Looking inside all 170,057 policies:
- 46.8% still contain
unsafe-inlineand 41.9%unsafe-eval— directives that substantially undermine a policy's protection against XSS. - Only 24.7% use a
nonce, a mere 1.6% usestrict-dynamic, and a vanishing 0.2% (just 318 sites) userequire-trusted-types-for, the strongest defence we have against DOM-based XSS. - On the brighter side, 45.9% set
frame-ancestorsand 32.7% useupgrade-insecure-requests.
So while CSP adoption has more than doubled, nearly half of all policies are in need of some TLC. Setting a CSP is the easy part; getting to a strong policy, that requires a little work.
| Directive | Sites | Share |
|---|---|---|
unsafe-inline |
79,464 | 46.8% |
frame-ancestors |
77,873 | 45.9% |
unsafe-eval |
71,094 | 41.9% |
upgrade-insecure-requests |
55,452 | 32.7% |
nonce-… |
41,936 | 24.7% |
has reporting (report-uri/report-to) |
8,134 | 4.8% |
strict-dynamic |
2,774 | 1.6% |
require-trusted-types-for (Trusted Types) |
318 | 0.2% |
The cross-origin isolation family (new)
For the first time, I've updated the crawler to track the modern cross-origin isolation headers, and adoption is already meaningful:
- Cross-Origin-Opener-Policy (COOP): 97,929 (+ 1,553 report-only)
- Cross-Origin-Resource-Policy (CORP): 57,719
- Cross-Origin-Embedder-Policy (COEP): 54,459 (+ 1,550 report-only)
- Origin-Agent-Cluster: 53,415
These are the headers that unlock cross-origin isolation and harden you against a whole class of cross-origin and Spectre-style attacks. Seeing them already on tens of thousands of sites is a good sign that the next generation of isolation primitives is taking root.
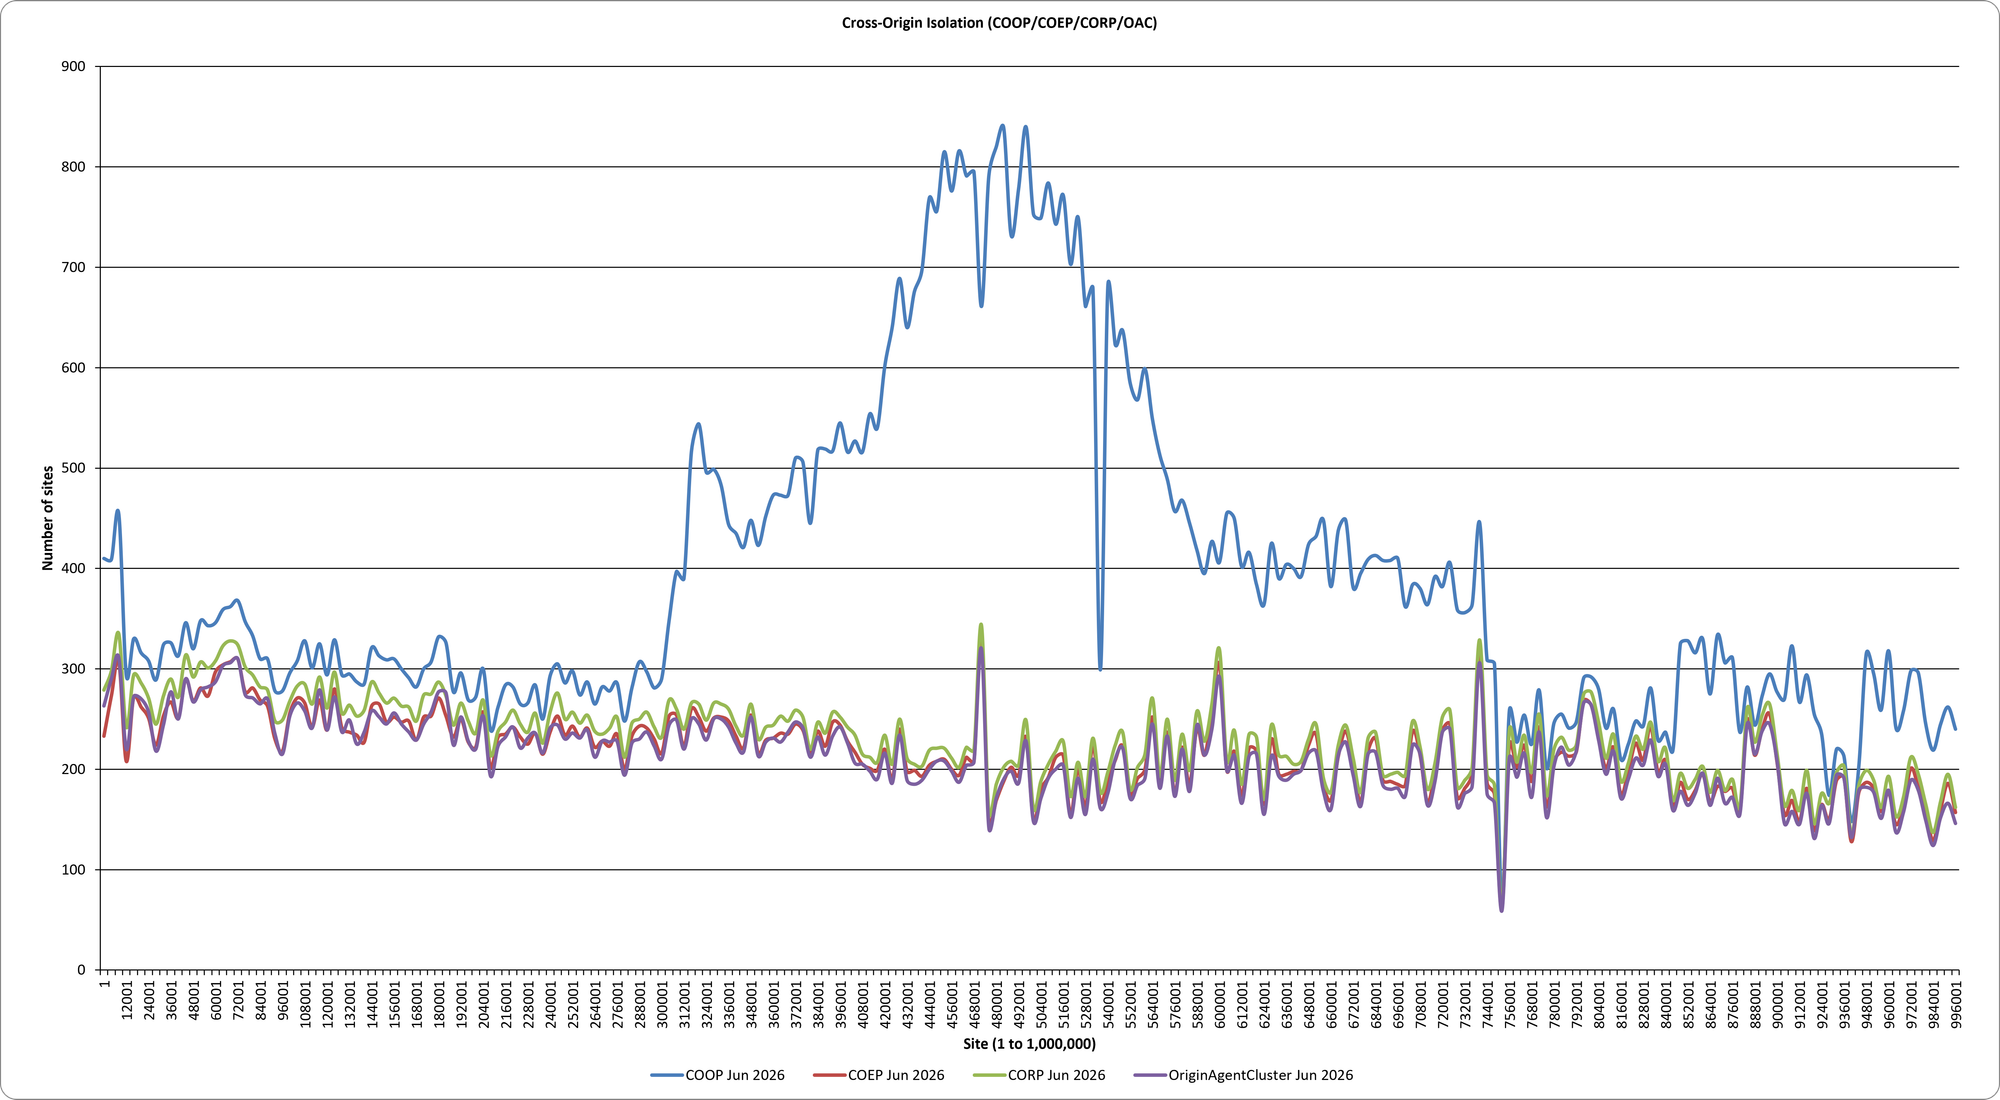
Looking at the general trend, we can see that these headers are more popular on the higher ranked sites, but there's also a very odd trend with COOP in the middle of the ranking! I've not looked into this enough to determine why that huge spike exists, but the raw data is available if you'd like to do some investigation.
The Reporting API explosion
Reporting is the metric that's exploded the most since the last report. Report-To is now on 289,021 sites and NEL on 285,620 — both an order of magnitude higher than the ~12,000 we saw back in 2020, almost entirely because Cloudflare enables Network Error Logging by default for the sites behind it. The modern successor, Reporting-Endpoints, is just getting started at 3,920 sites.
Just how concentrated is it? Of all those Report-To endpoints, a.nel.cloudflare.com appears on 279,362 of them — about 97% — so this entire metric is, in effect, one company's default. The rest is a long tail: Google's csp.withgoogle.com (1,378), Heroku's NEL endpoint (1,257), and a scattering of others. Report URI is the destination on 865 sites across their CSP and Report-To configurations (210 of them in the Report-To header specifically) — which, as the person who runs it, I'm always happy to see. Sadly, we're under-represented in the numbers based on our typical customer's deployment model. The crawler is only looking at the homepage of each site and we have large numbers of customers that only deploy our solution on sensitive areas of their site like account sections, payment flows, etc.
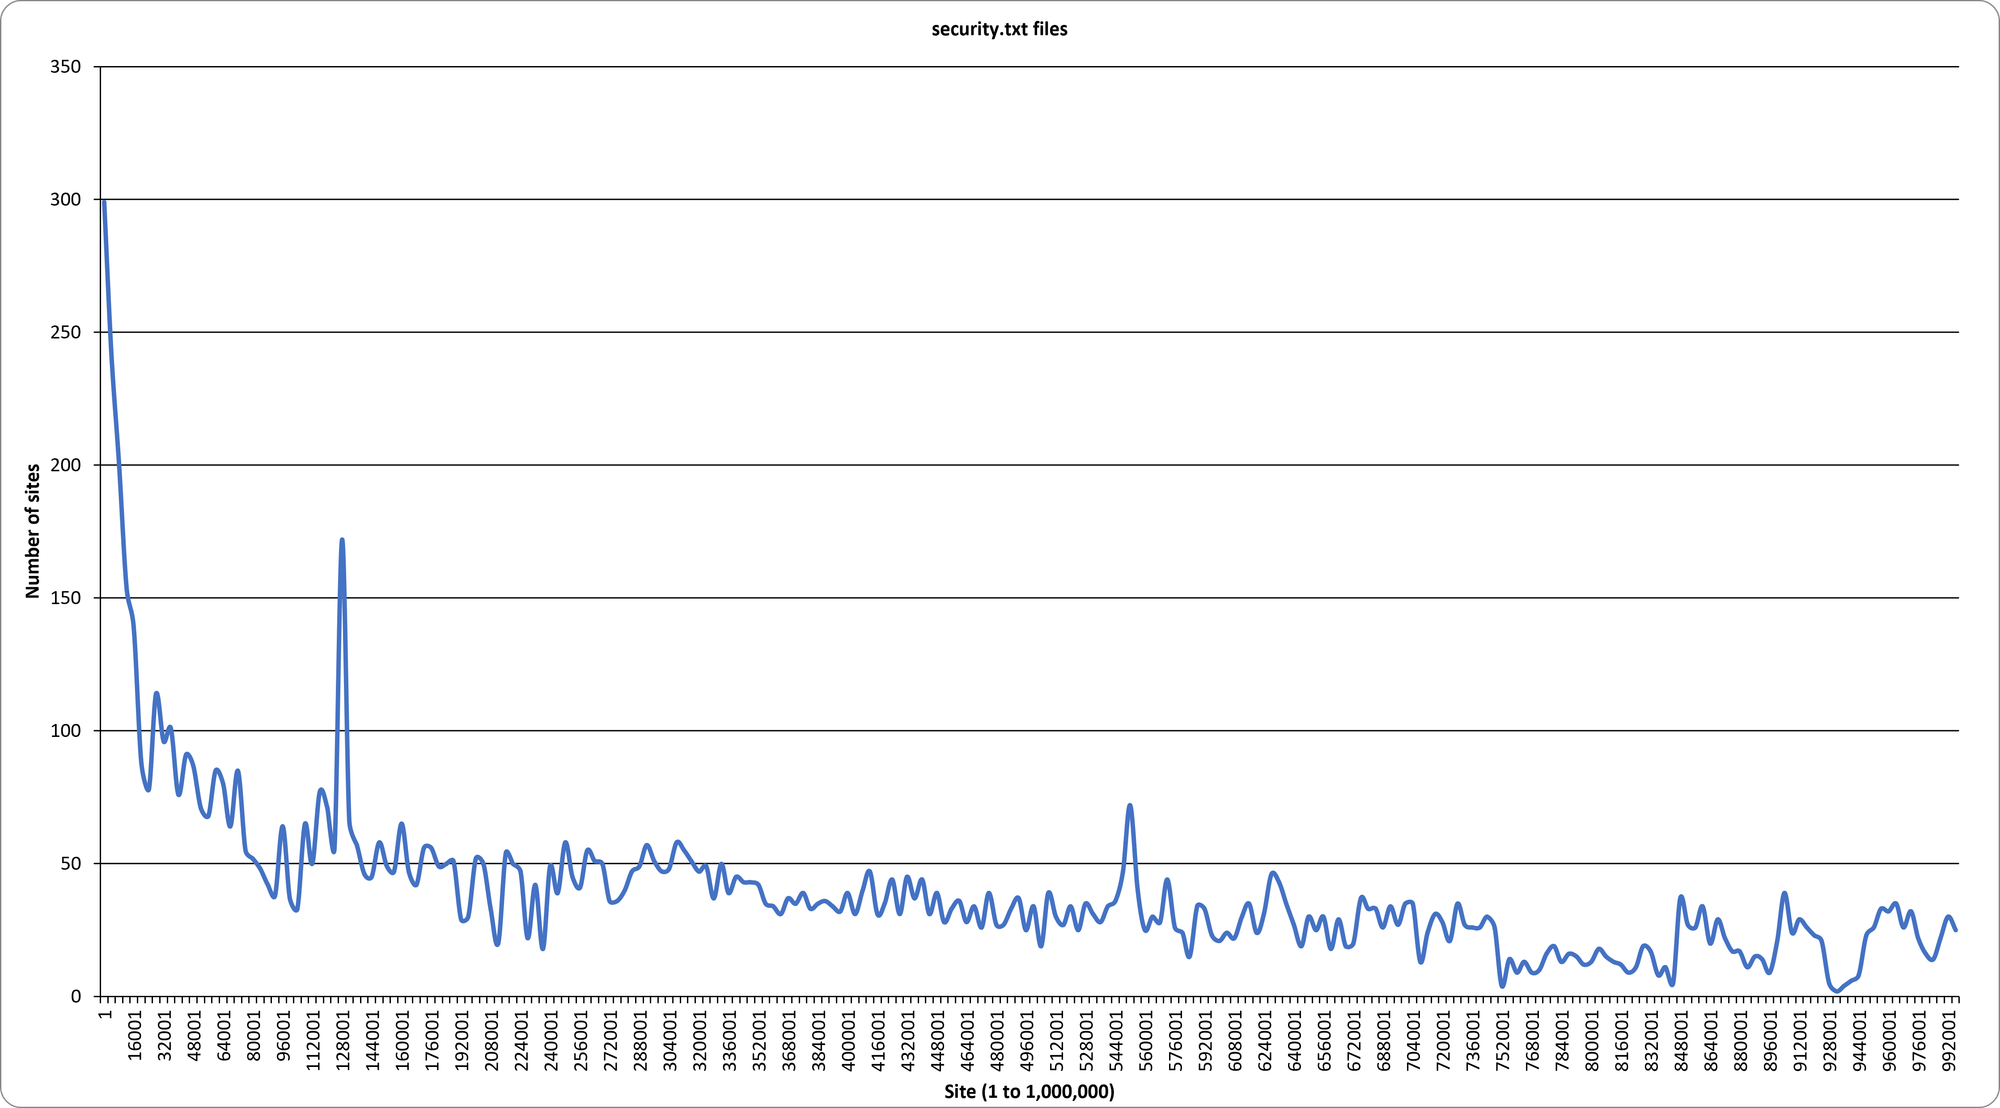
security.txt
A modest year for security.txt: 9,927 sites publish a valid /.well-known/security.txt, up about 10% on 2022. It's now an RFC and a genuinely useful way to receive vulnerability reports, so I'd love to see this one continue to grow.
What your headers give away (new)
This year I started analysing the information-disclosure headers, and the results are a nice reminder that plenty of sites are still broadcasting their stack to anyone who asks. The most common X-Powered-By values:
ASP.NET— 22,035Next.js— 17,541PleskLin— 15,023WP Engine— 10,445PHP/7.4.33— 9,264
That last one is the interesting one: 9,264 sites are advertising an exact, end-of-life PHP version (7.4 stopped receiving security updates back in 2022). That's a gift to an attacker — free reconnaissance, handed over in a response header. There's no upside to sending X-Powered-By; turn it off.
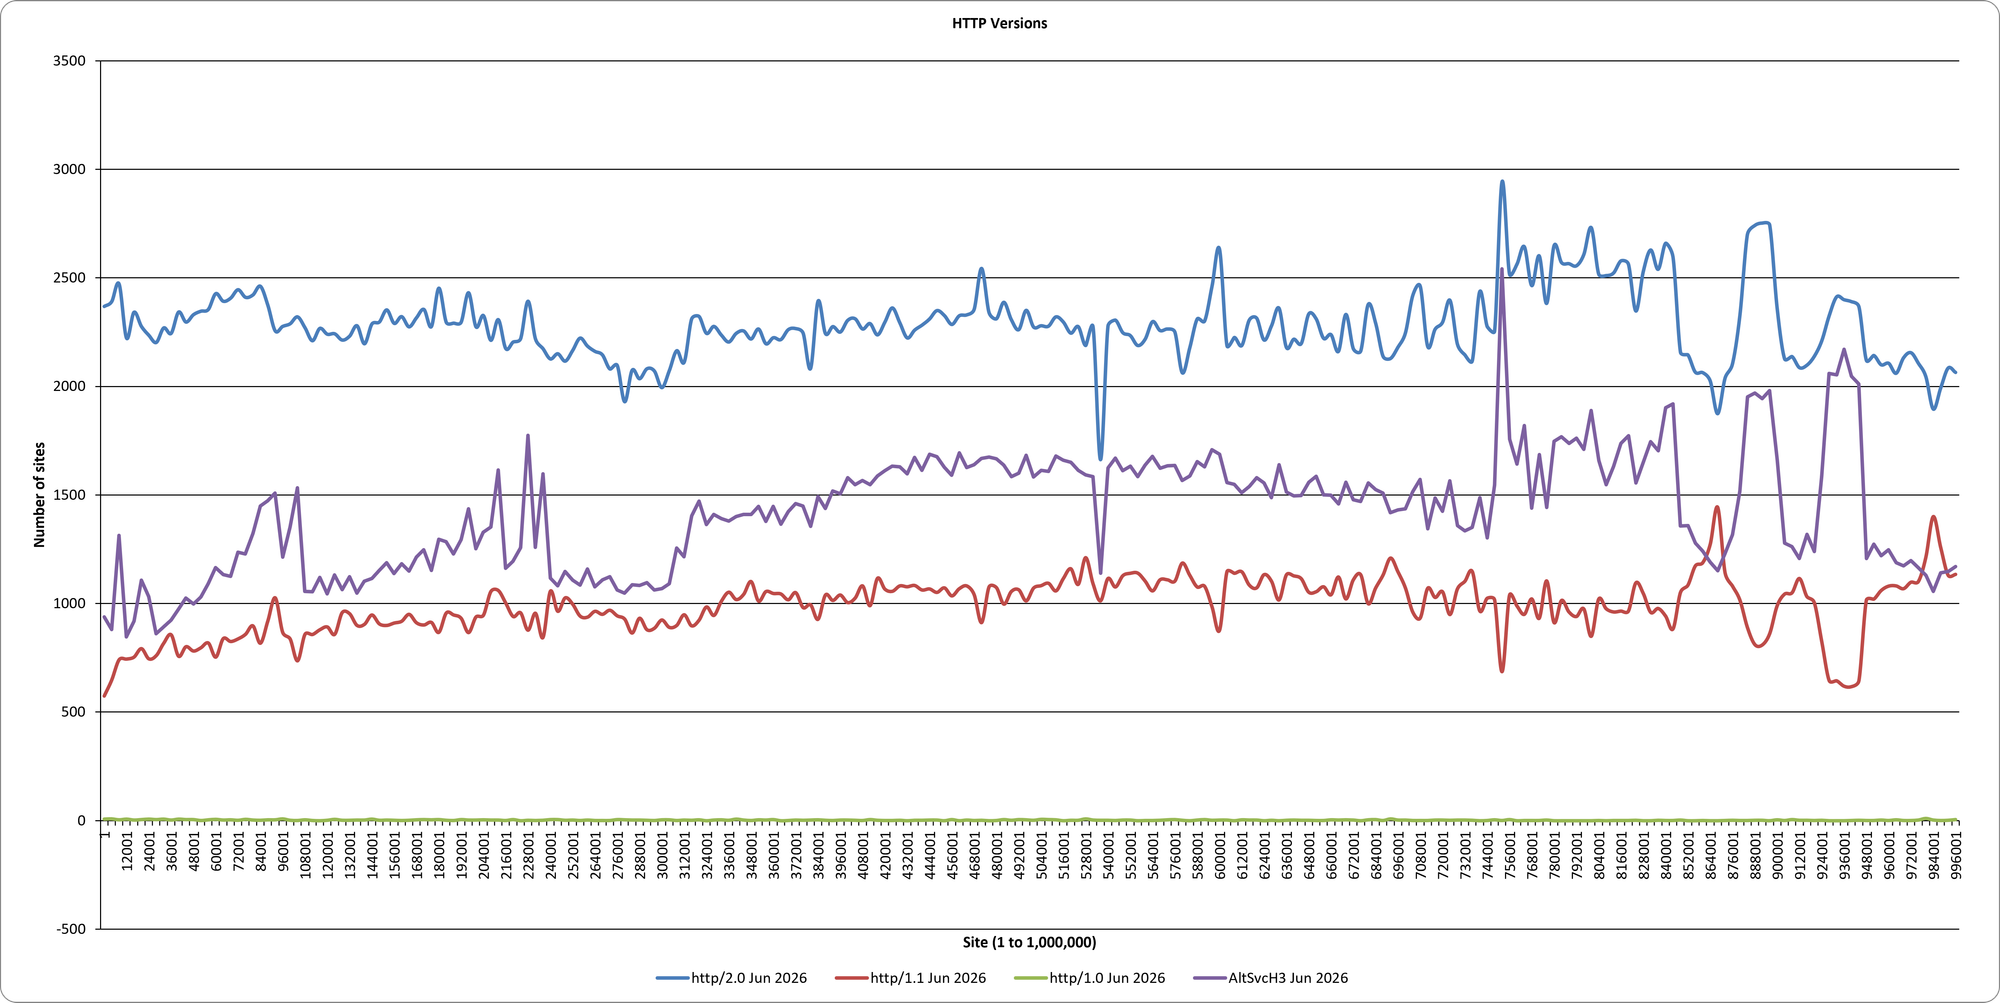
HTTP/3 and HTTP versions
The transport layer keeps modernising. HTTP/2 is now on 570,952 sites (up from 454,560 in 2022), HTTP/1.1 has fallen to 247,392, and HTTP/1.0 is nearly gone at 630. HTTP/3 isn't negotiated directly by the crawler, but I now measure its advertisement via the Alt-Svc header, and 356,380 sites advertise h3 — a huge footprint, driven by Cloudflare and the other big CDNs enabling it by default.
Cookies (new)
For the first time I've recorded the security attributes on Set-Cookie headers (flags only — no cookie values are ever stored). Of the 314,878 sites that set at least one cookie:
- Secure: 189,528
- HttpOnly: 223,384
- SameSite: 176,300
__Host-prefix: 802__Secure-prefix: 1,913
So a majority of cookie-setting sites get the basics (HttpOnly, Secure) right, but the genuinely robust cookie-hardening primitives — the __Host- and __Secure- prefixes — are barely used at all. There's a lot of headroom here, they're free, and you can find all of the information in my blog post Tough Cookies.
Email & DNS security (new)
The crawler now performs a whole bunch of DNS lookups alongside the HTTP request too, which surfaces a set of metrics this report has never covered. DMARC: 398,597 sites publish a DMARC record, and the split is interesting:
| Policy | Count | Share |
|---|---|---|
| p=none (monitor only) | 204,769 | 51.4% |
| p=quarantine | 100,134 | 25.1% |
| p=reject | 93,264 | 23.4% |
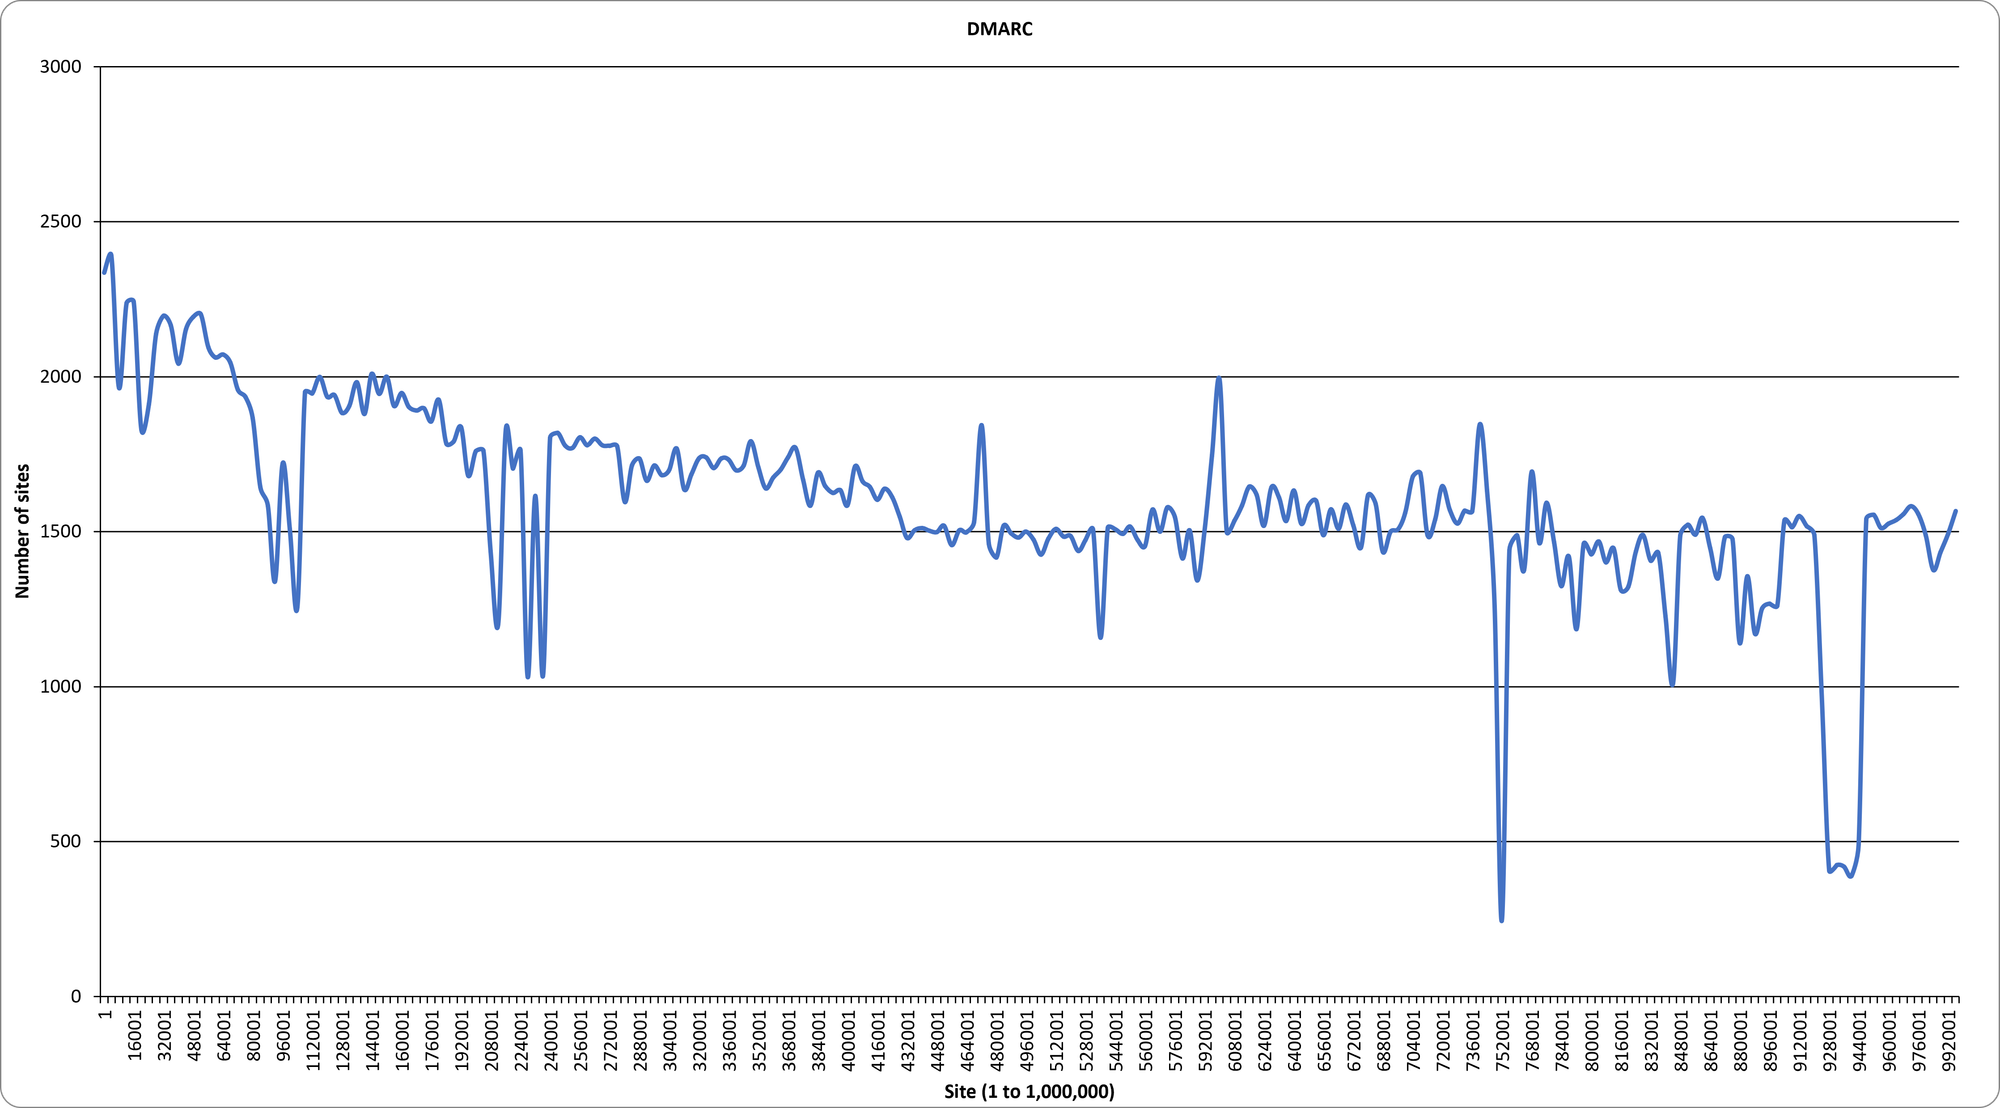
Roughly half are still in monitor-only mode and haven't turned on real protection. Looking further:
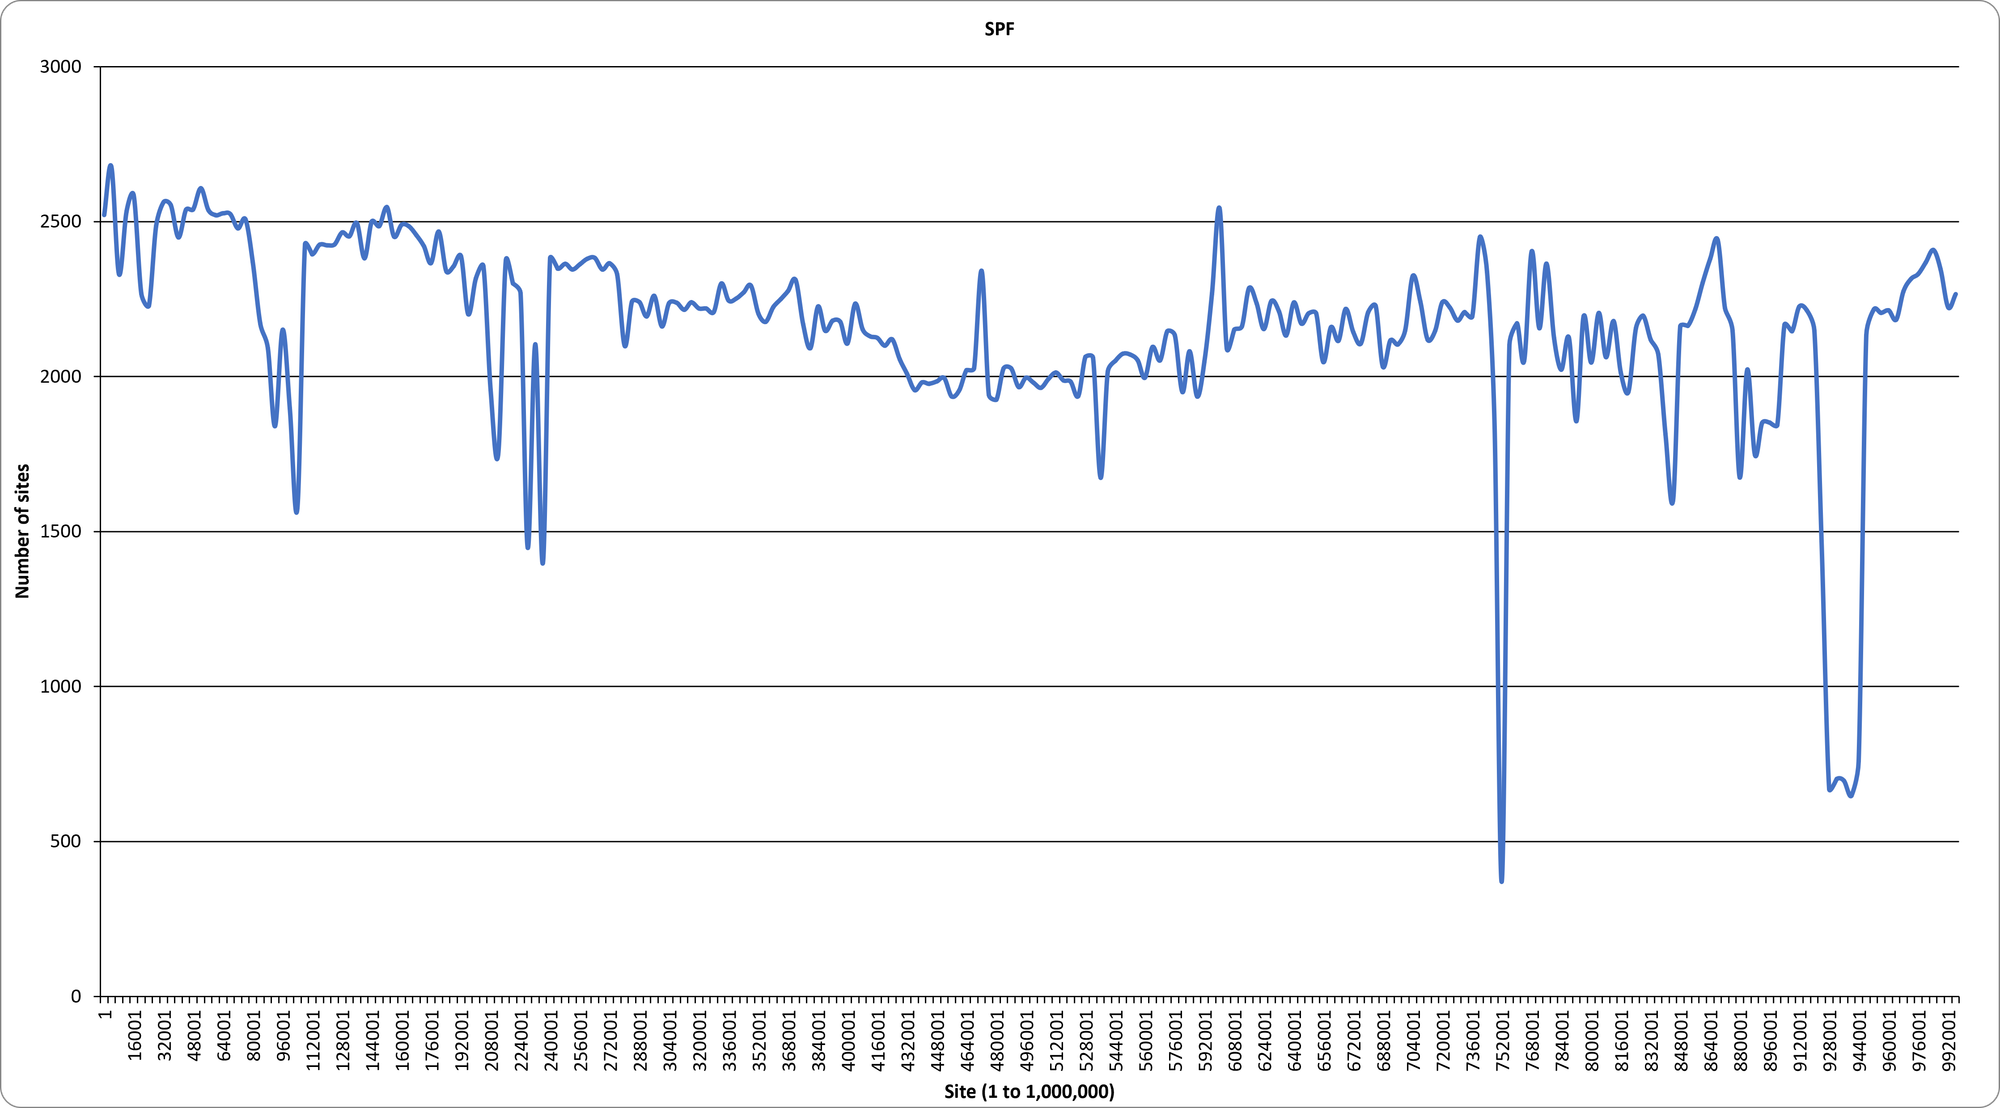
- SPF: 538,011 sites.
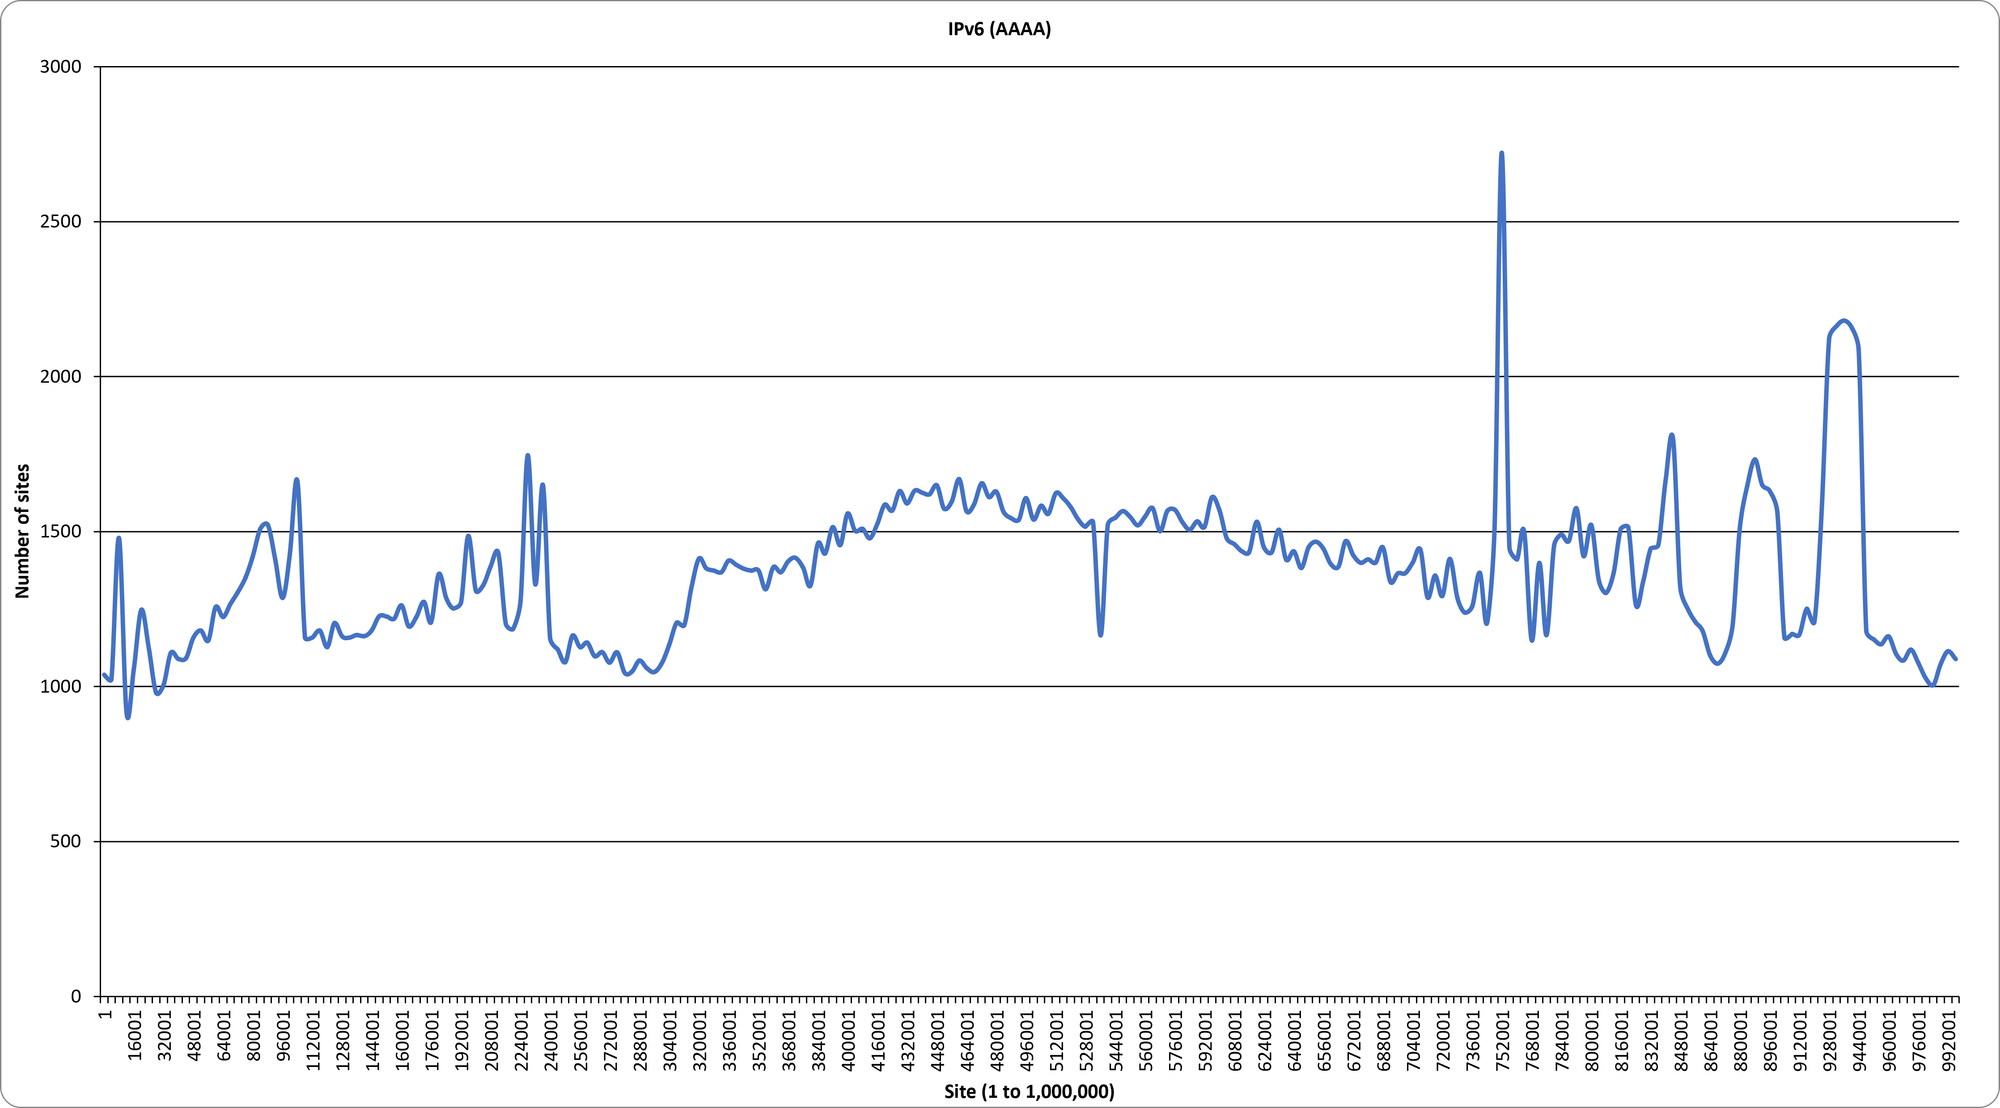
- IPv6 (AAAA): 344,430 sites — IPv6 is still a minority at ~42%, a decade into "the year of IPv6".
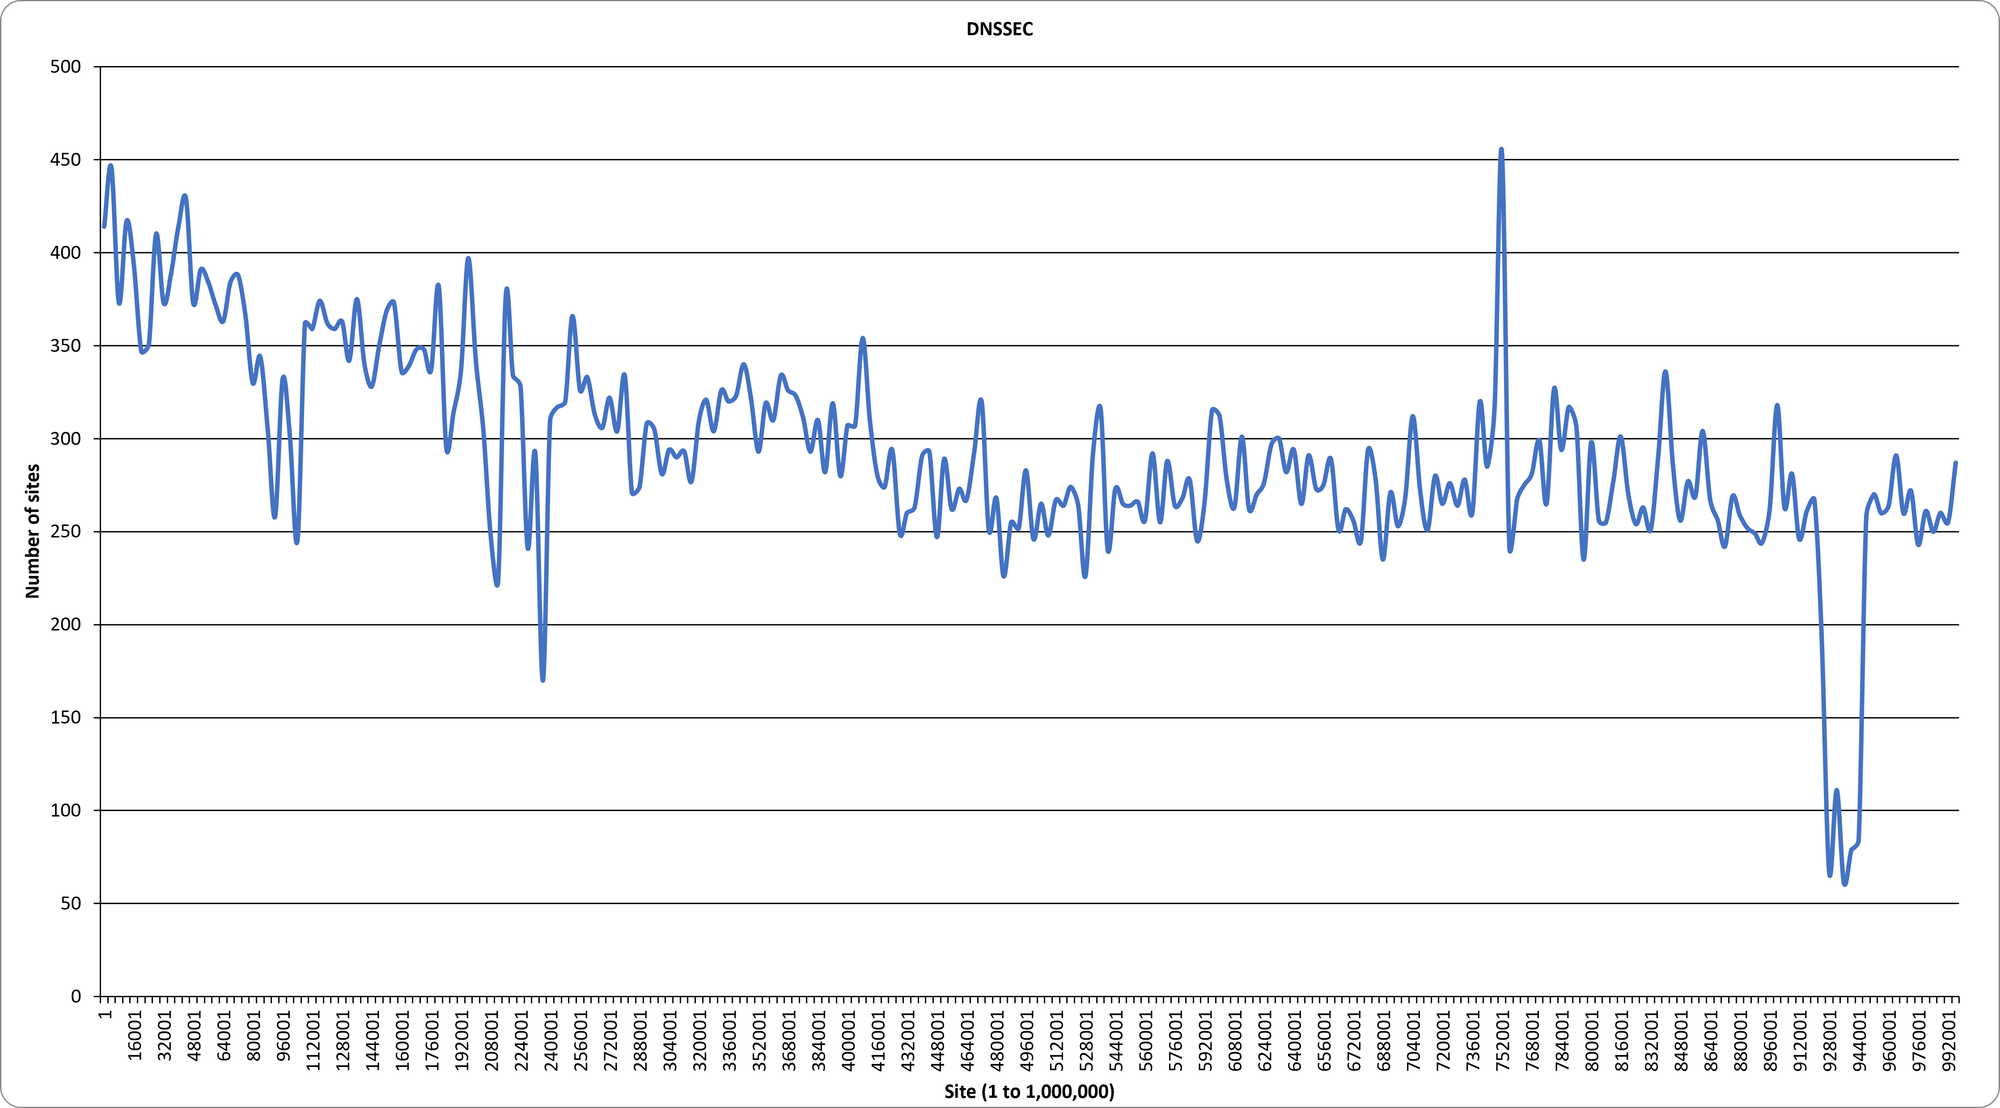
- DNSSEC: 73,405 sites — persistently low, as it always has been.
Fossils of the web
Every crawl turns up headers that outlived the problem they were supposed to solve.
- HPKP (Public-Key-Pins): still on 654 sites, even though I blogged about it being removed back in 2020.
- FLoC opt-out (
interest-cohort=()): 5,872 sites still send the opt-out for an advertising technology Google cancelled in 2022. - X-XSS-Protection (covered above): 163,114 sites, for a browser feature that no longer exists, and I blogged about XXP being removed back in 2019.
We seem to be holding on to some of these headers much longer than we should, so consider this a friendly nudge to delete the ones you don't need.
Servers & infrastructure
The infrastructure picture is more concentrated than ever. By Server header:
| Server | Count |
|---|---|
| cloudflare | 361,366 |
| nginx | 105,829 |
| Apache | 67,461 |
| LiteSpeed | 22,850 |
| Microsoft-IIS/10.0 | 14,818 |
| AmazonS3 | 9,095 |
| openresty | 8,028 |
| nginx/1.24.0 (Ubuntu) | 7,810 |
| Vercel | 7,685 |
| CloudFront | 6,369 |
Cloudflare alone now fronts well over a third of the responding sites, which explains a lot of what we've seen above: when one provider flips a default — HTTP/3, NEL, the cross-origin headers, or (as we'll see in part two) post-quantum primitives — it moves the entire web's numbers overnight. By TLD, .com dominates as always.
| TLD | Count |
|---|---|
| .com | 360,571 |
| .net | 34,704 |
| .org | 34,015 |
| .uk | 28,940 |
| .ru | 28,603 |
| .de | 25,384 |
| .br | 14,544 |
| .nl | 12,929 |
| .jp | 10,812 |
| .in | 9,503 |
Security Grades
Finally, the securityheaders.com-style grade across the responding sites is a humbling reality check:
| Grade | Jun 2022 | Jun 2026 |
|---|---|---|
| A+ | 2,860 | 10,496 |
| A | 31,281 | 61,350 |
| B | 33,333 | 71,700 |
| C | 38,462 | 40,991 |
| D | 139,632 | 166,412 |
| E | 9,951 | 25,815 |
| F | 564,740 | 440,832 |
| R (redirect) | — | 1,406 |
More than half the web still scores an F on basic security headers — though there's real progress hiding in that number: the F count actually fell by around 124,000 since 2022 while every higher grade grew. Slow, but in the right direction.
Closing thoughts
Looking back over ten years of data, the overall trend is clear: the web is in a much better place than it used to be. HTTPS is now the norm, HSTS is far more common, CSP adoption continues to grow, and newer mechanisms like the Reporting API, COOP/COEP and Permissions-Policy are starting to appear at meaningful scale. That progress matters, and it represents a huge amount of work across browsers, hosting providers, CDNs, developers, security teams and standards bodies.
But adoption alone doesn’t tell the whole story. Many sites now have the right headers, policies or controls present, but they are often incomplete, overly permissive, or deployed in a way that limits their real-world value. A CSP with unsafe-inline, an HSTS policy with a tiny max-age, cookies missing key attributes, or a DMARC policy stuck at p=none all show the same thing: getting the feature deployed is only the first step.
The encouraging part is that the direction of travel is positive. The challenge for the next ten years is not just getting more sites to turn these protections on, but helping them turn them on properly. Better defaults from platforms, clearer guidance from standards, and tooling that makes secure configuration easier will continue to move the web forward. The web has made real progress, but there is still a lot of value left on the table.
Get the data
As always, everything is open. The full per-metric files, the raw MySQL dump, and the daily crawl data are available via Crawler.Ninja, there for anyone who wants to do a deeper dive than I have here.
Ten years in, the picture is genuinely mixed: the foundations are in great shape and getting better, the new isolation and reporting primitives are taking root, but the security-header long tail has barely moved and over half the web still scores an F. Plenty left to do.
And that's just the headers and hygiene. For the really interesting story this year — TLS, certificates, the collapse of the one-year certificate, and post-quantum cryptography arriving on nearly half the web — head over to part two when it's published tomorrow. Here's to the next ten years, and hopefully not another four-year gap before the next report!
*Crawl date: 13 June 2026. 819,002 responding sites from the Tranco Top 1 Million. Powered by Crawler.Ninja and Report URI.