
3 months ago I launched report-uri.io, my CSP and HPKP violation reporting service. Since then the service has seen steady growth and I've been incredibly pleased with how much exposure it's getting. This is a quick look over the numbers after the first 3 months.
Everybody loves graphs, so here we go! Note: all graphs and costs are for the 1 week period shown.
Total number of transactions
The first and biggest number is the sheer amount of transactions being issued against my Azure Table Storage database. Averaging very comfortably around 1.3-1.4 million transactions per week this is phenomenal!
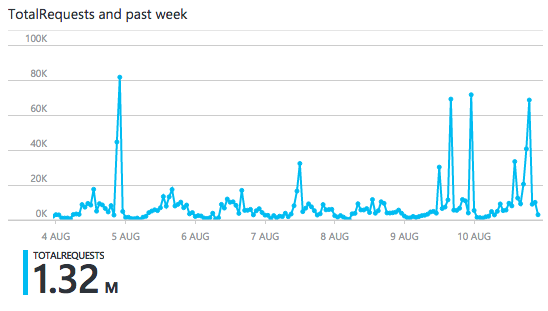
Covering all transactions issued against Azure that week, this can be broken down into 3 main categories. Hits against my PHP Session Store, queries for graphs and tables in the account section and mainly incoming reports. Each page hit generates 1 transaction against Azure to either create or lookup the current session for the visiting user. The graphs and tables can also issue several queries against the backend to fetch the required data to display to the user. Lastly, each inbound report generates 5 hits against the table due to the way I've de-normalised the data to allow for faster querying (more on that in another blog). Doing some rough calculations with the numbers that I have, it puts the total number of inbound violation reports around 250,000 per week!
Average Latency
Another 2 important metrics that I track via the Azure Portal are the average latency of each transaction against the database. I monitor the average server latency, that is the amount of time Microsoft spend dealing with the transaction, and the average end-to-end (E2E) latency which is the total time the transaction took including network latency.
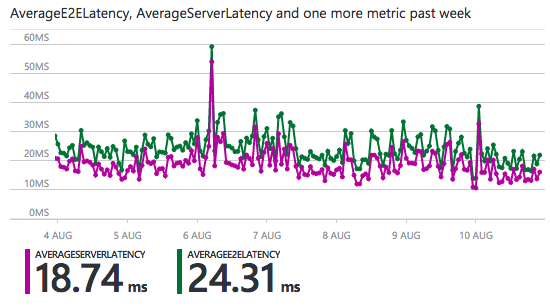
As you can see from the graph, it takes the server an average of 18.74ms to handle each transaction against the database, pretty snappy! If I look at the E2E latency things are still pretty fast considering I'm hosting my application servers with another hosting provider, although I did make sure they were very close geogrpahically to keep that latency down. At 24.31ms per request including network latency, it's still incredibly quick.
Availability and Success Rate
Next up is the availability of the database and the success rate of transactions against it. The 100% availability is very pleasing but let me explain about that success rate, it's not what it first seems.
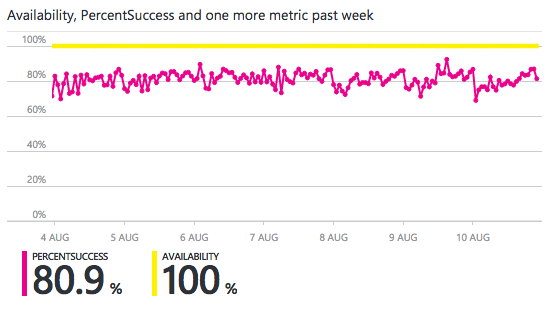
The success rate shown here is slightly different to what you might expect as transactions against the database to lookup an item that doesn't exist counts as a failure. When I receive an inbound report I hash the body of the report and use it as a lookup to see if the user already has this report in their table. If they do, the query retrieves the report and I increment the count. If not, the query fails and I insert the new report and initialise the count. This is a really great insight into the kind of data I'm receiving and shows that roughly 80% of the reports that are received are duplicates of reports that are already in the database.
Total ingress and egress
Lastly we can take a look at the total amount of data coming in and out of Azure.
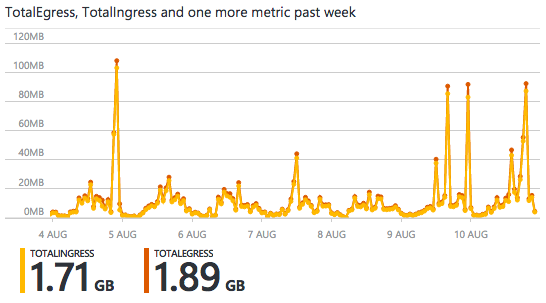
As you would expect, there is a clear correlation between the rate of transactions against the database and the amount of ingress and egress I'm seeing. The one thing I didn't expect was such a similar amount of ingress and egress. The inbound reports mostly create ingress and the queries for the UI like graphs and tables generate egress. I would have expected a little more of a difference between the two, but this is the kind of insight that data like this can give you. You find things you expected to see but more interestingly, you find things you didn't expect to see.
Cost
Azure Table Storage
One of the the most common things that I get asked about when talking about Azure Table Storage is the cost. It was also one of the bigger factors for me when I was building the service. The site had to perform well, it had to have redundancy but it also had to be affordable or the whole thing wouldn't get off the ground. Fortunately, Table Storage is very affordable! Here's the cost for the same week shown in the graphs above.
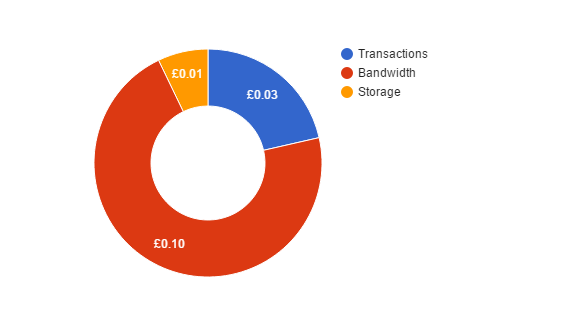
All in all, it costs a little under £0.14 (I rounded up for some of the items) to have Azure handle 1,320,000 database transactions, including associated costs, per week. That also includes everything like provisioning of hardware, managing the underlying systems, updates, patches, testing, backup, redundancy, load balancing and everything else I forgot. It's simply awesome and there just isn't a comparison for having created and run my own database. Another great thing I love about writing blogs like this is the things that I learn along the way. Let me show you the above cost chart another way.
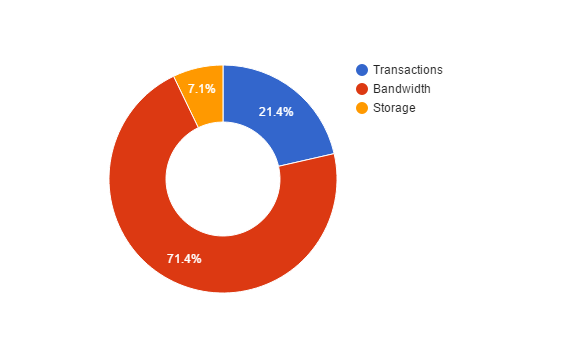
I would have never anticipated that outbound bandwidth would have been my largest cost accounting for 71.4% of my total bill! Right now it's 71.4% of not very much, but going forwards as the costs increase, it's a good place to look to try and optimise if I want or need to bring those prices down. There might be queries where I can return less properties to reduce what is returned or queries that I can optimise to return a smaller payload. The main thing is that being armed with this kind of data allows those decisions to be a lot more informed.
DigitalOcean
Whilst I'm using Azure to cater for my database needs, I'm using DigitalOcean (referral link gets you $25 free credit!) to provide my hosting infrastructure. My hosting costs for the same week shown above were £3.77! At the time of writing that was for the use of 2 load balancers and 3 application servers in my pool to handle every request thrown at the site. What's even better is that none of them even broke a sweat as I'm currently over-provisioning by a considerable margin. All in all, that means I paid less than £4 ($6USD) to host the entire site for 1 week with 1.3 million requests being thrown at it. Not half bad I don't think!
Looking forwards
Over the coming months I'm going to be continually working on the site to add new features and expand existing ones. I've had some great feedback from the community with ideas for the site, many of which will be coming this year. If you have any ideas then please feel free to leave them in the comments below or get in touch with me via email which you can find at the top of the page. I'm hoping to grow report-uri.io into an incredibly powerful site to cater for all of your CSP and HPKP needs and that also means that more tools are in the works too! Stay tuned for more information in the coming weeks.