
I simply can't believe that Report URI has now processed 1,500,000,000,000+ reports, which is unreal! That's over one trillion, five hundred billion reports... 🤯
This tiny little project, that I had the idea of starting all those years ago, is now processing incredibly large amounts of data on a day-by-day basis. So why don't we take a look at the numbers?

Report URI
If you aren't familiar with Report URI, here's the TDLR: Modern web browsers have a heap of security and monitoring capabilities built in, and when something goes wrong on your site, they can send telemetry to let you know you have a problem. We ingest that telemetry on behalf of our customers, and extract the value from the data.
Over the years, as our customer base has grown, we are of course receiving more and more telemetry from more and more clients. This has also been expanded to include email servers which can also send telemetry about the security of emails you send! If you want any details on our product offering, the Products menu on our homepage will help you out, but this blog post isn't about that, it's about the numbers!
Our infrastructure
In a recent blog post I gave an overview of our infrastructure which really hasn't changed much over the years and has held up really well to the volume of traffic we're handling. I'll repeat the highlights here because it will help make the following data more understandable once I get into it. Here's the diagram that explains our traffic flow, along with the explanation, and you can see it's the exact same diagram I published over 5 years ago when I last spoke about it, and our infrastructure was the same long before that too:
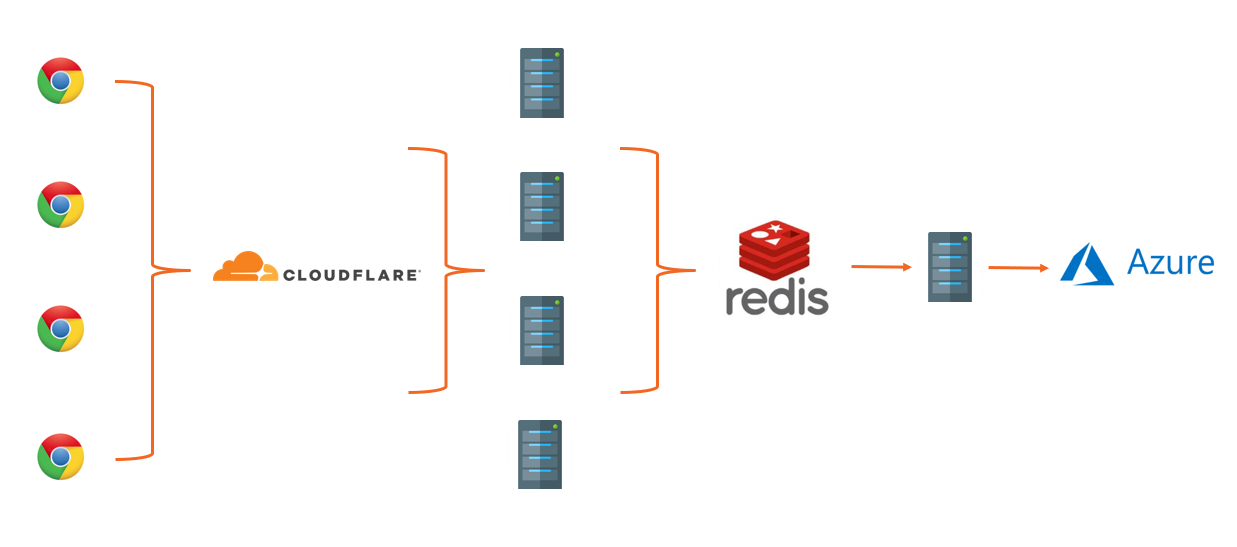
- Data is sent by web browsers as a POST request with a JSON payload.
- Requests pass through our Cloudflare Worker which aggregates the JSON payloads from many requests, returning a 201 to the client.
- Aggregated JSON payloads are dispatched to our origin 'ingestion' servers on a short time interval.
- The ingestion servers process the reports into Redis.
- The 'consumer' servers take batches of reports from Redis, applying advanced filters, threat intelligence, quota restrictions and per-user settings and filters, before placing them into persistent storage in Azure.
When traffic volumes are low during the day, this entire processing pipeline averages less than sixty seconds from us receiving the report to you having the data in your dashboard and visible to you. When all of America is awake and online, our busiest period of the day, we typically see processing times between three and four minutes, with the odd outliers taking possibly five or six minutes to make it through. Overall, we work as much as we can to get this time down and keep it down, but I think it's pretty reasonable.
The history of the service
I first launched Report URI in May 2015 after having worked on it and used it myself for quite some time and since then, I've covered it extensively right here on my blog. You can find the older blog posts using this tag, and the newer ones using this tag, but any change worth mentioning is something I've talked openly about. Here's a quick overview of how our report volume has grown over time.
Sep 2015 - 250,000 reports processed in a single week
Sep 2016 - 25,000,000 reports per week
Mar 2017 - 80,000,000 reports per week
Jun 2017 - 677,000,000 reports per week
Jul 2018 - 2,602,377,621 reports per week
Jun 2019 - 4,064,516,129 report per week
Mar 2021 - we hit half a trillion reports processed
That last one was a particularly big milestone and I feel like something that was really worth celebrating. Just think, half-a-trillion reports processed!
It's absolutely wild that I can now say we've processed over HALF A TRILLION REPORTS for our customers!
— Scott Helme (@Scott_Helme) March 14, 2021
The current total as of this tweet stands at:
500,205,618,910 reports!!! 😲 https://t.co/jWQNQYX2dP
We pushed on to hit our one trillionth report a little bit more quickly too! Michal even caught the point when it rolled over.
1 trillion OMG we've just processed 1 TRILLION reports 😲😍🍻 That's a loooooooooooot of JSON & XML! Good job everyone 🕺 @reporturi @Scott_Helme @troyhunt pic.twitter.com/fYohs4LmKD
— Michal Špaček (@spazef0rze) February 5, 2022
Now, as I sit here, we've pushed 1.5 trillion reports... But, enough about where we were, let's talk about where we are and what we're doing today, starting with what volumes we're processing now.
From the top!
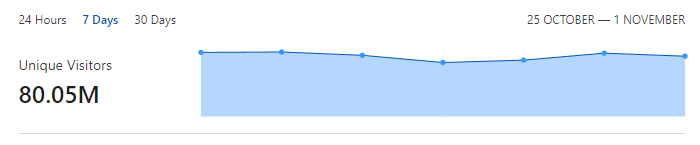
Our first point of contact for any inbound report will be Cloudflare, so I'm going to grab the data for the last 7 days from our dashboard to take a look at. Here's just the raw number of requests that we've seen hit our edge.
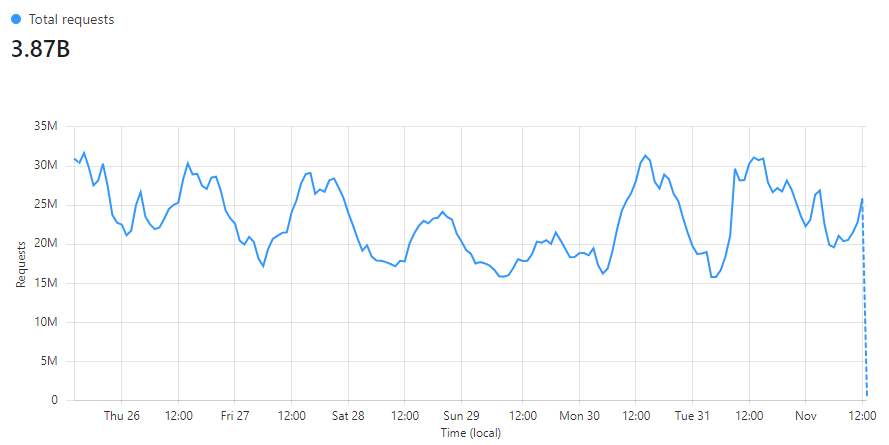
In the last 7 days we saw over 3,870,000,000 requests coming in! You can see many of our common patterns trends in terms of the peaks and troughs throughout the day, and also that weekends are generally less busy than weekdays for us too. I love looking at our data egress graph because the only thing our reporting endpoint sends back is empty responses. They're usually either a 201 when we accept a report, or a 429 if you have exceeded your quota, but always empty, and there's a lot of them.
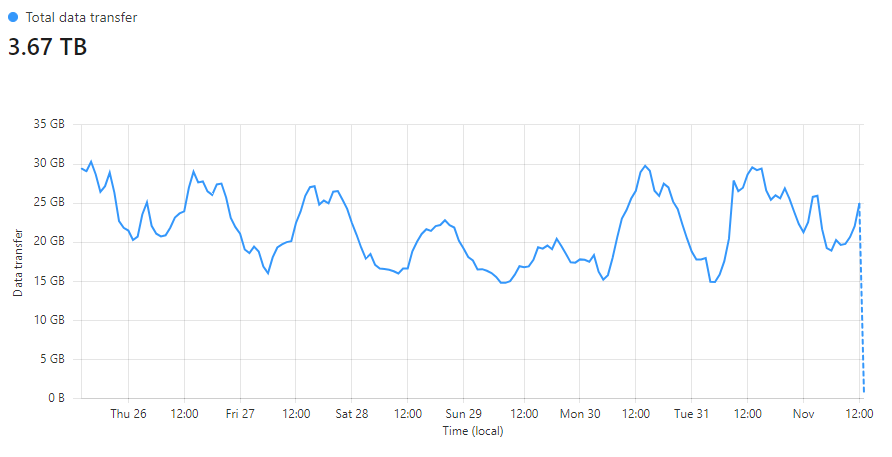
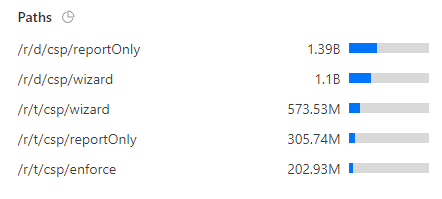
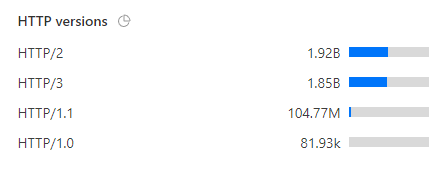
We've served a staggering 3.67TB of empty responses over the last 7 days! I also like to watch trends in how data reaches us and we can also gather some really interesting information at this scale. Take any of the following metrics for example, where we can look at how our service is being used, seeing that most people are, as expected, generating report volume in report-only mode or via our CSP Wizard.
We can also see some interesting data about clients sending reports too.
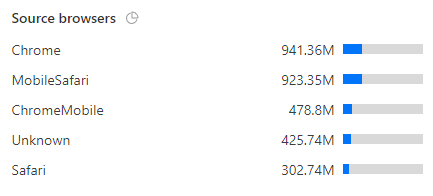
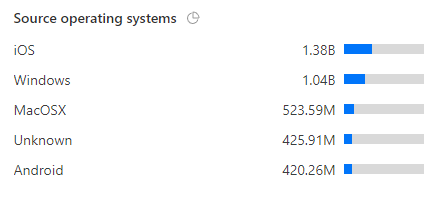
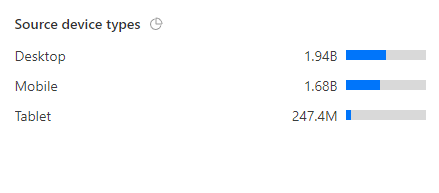
Of course, we see clients sending us many requests, but we've still received reports from over 80,000,000 unique clients!
That's a lot of browsers...
Through the Cloudflare Worker
All reports that hit our edge go through our Cloudflare Worker for processing. It does some basic sanitisation of the JSON payloads, normalisation, and maintains state about our users to know if they are exceeding their quota so reports can be dumped as early as possible. This of course means that the number of requests hitting our Worker is going to be the same as the number of requests we're receiving at the edge.
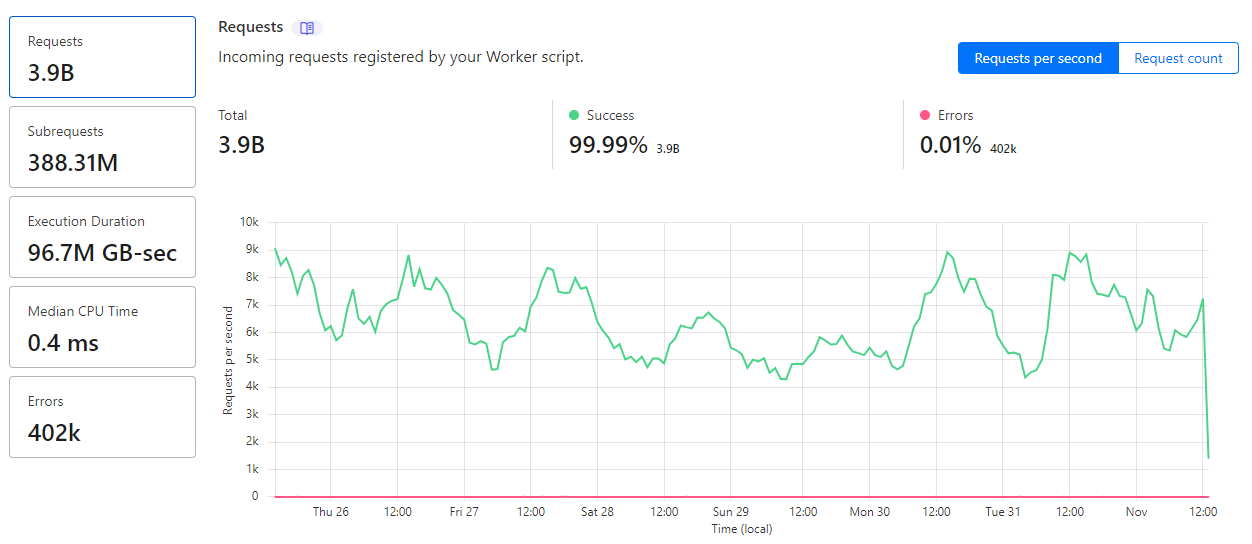
What's interesting to see is that at peak times we're receiving around 9,000 requests per second and that's a typical week for us. If a new customer joins suddenly, or an existing users deploys a misconfiguration suddenly, we've seen spikes up and over 16,000 requests per second coming in. As I mentioned in the opening paragraph though, our Worker batches up reports from multiple requests and sends them to our origin after a short period, which you can see in our Subrequests metric. Despite receiving 3,900,000,000 requests in the last 7 days, the Worker has only sent 388,310,000 requests to our origin, meaning we're batching up ~10,000 reports per request to our origin on average. This is a metric we track to fine tune our aggregation and load, but looking at it live right now, we can see that the numbers line up.
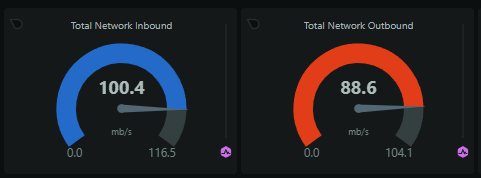
This translates to over 100 mb/s of JSON coming in to our origin per second, and bear in mind, this is massively normalised and deduplicated. Our ingestion servers take these reports and then process them into our Redis cache, so our outbound from these servers is pretty similar to the inbound, as not many reports are filtered/rejected at this stage.
Into the Redis cache
Our Redis cache for reports is a bit of a beast, as you may have guessed, and it's where reports sit for a short period of time. The cache acts as a buffer to absorb spikes and also allows for a little bit of deduplication of identical reports that arrive in a short time period, further helping us optimise. Looking at the RAM consumption, you can see reports flowing into the cache and also see when the consumer servers pull a batch of reports out for processing.
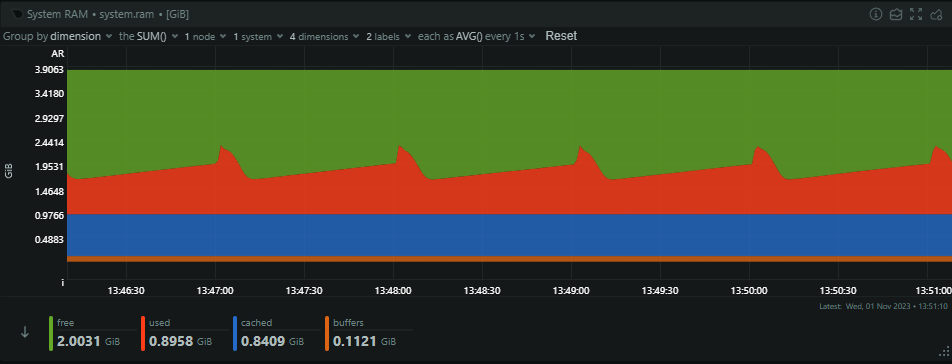
At present, we're not at our peak, but the Redis cache is handling almost 4,500 transactions per second, which isn't bad!
Consumption time!
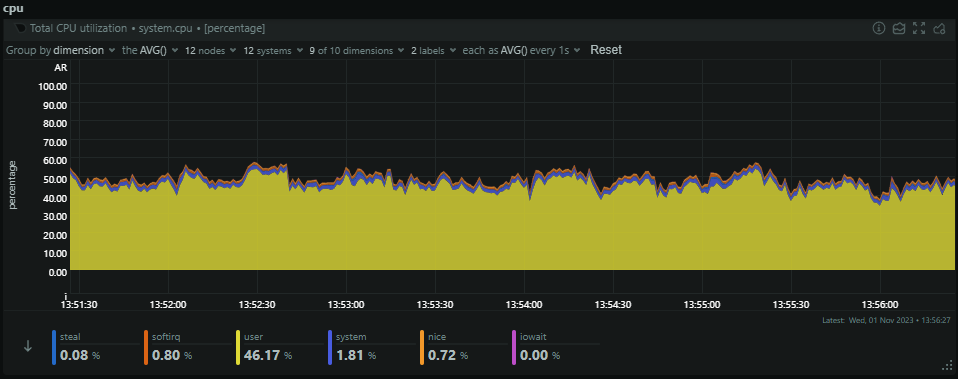
The final stop in our infrastructure is through the consumer servers, which pull out batches of reports from the Redis cache to process into persistent storage in Azure Table Storage. We run a slightly smaller number of consumer servers with a lot more resources and these are the servers that are always being worked hard. Looking at their current CPU usage, they're sat at ~50% CPU as we start to approach the busiest time of the day, but they will still climb from here.
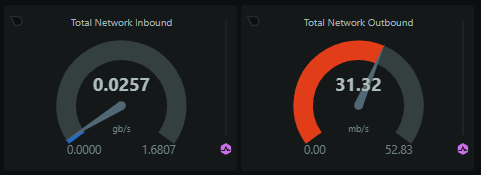
The consumers will only see small spikes in inbound traffic when they pull a batch of reports from Redis, but they will always have a fairly consistent outbound bandwidth to Azure as they're pushing that data out to persistent storage.
From here, it's on to the final stop for report data and after this point, it will visible in your dashboard to query, and any alerts/notifications will have been sent.
Azure Table Storage
I've used Azure Table Storage since the beginning of Report URI and it's something that I've never been given a good reason to move away from. It's a simple key:value store and is massively scalable, meaning I've never had to learn how to be a DBA and it's always taken care of for me. You can read some of my blog posts about Table Storage, but let's see how much we're using it.
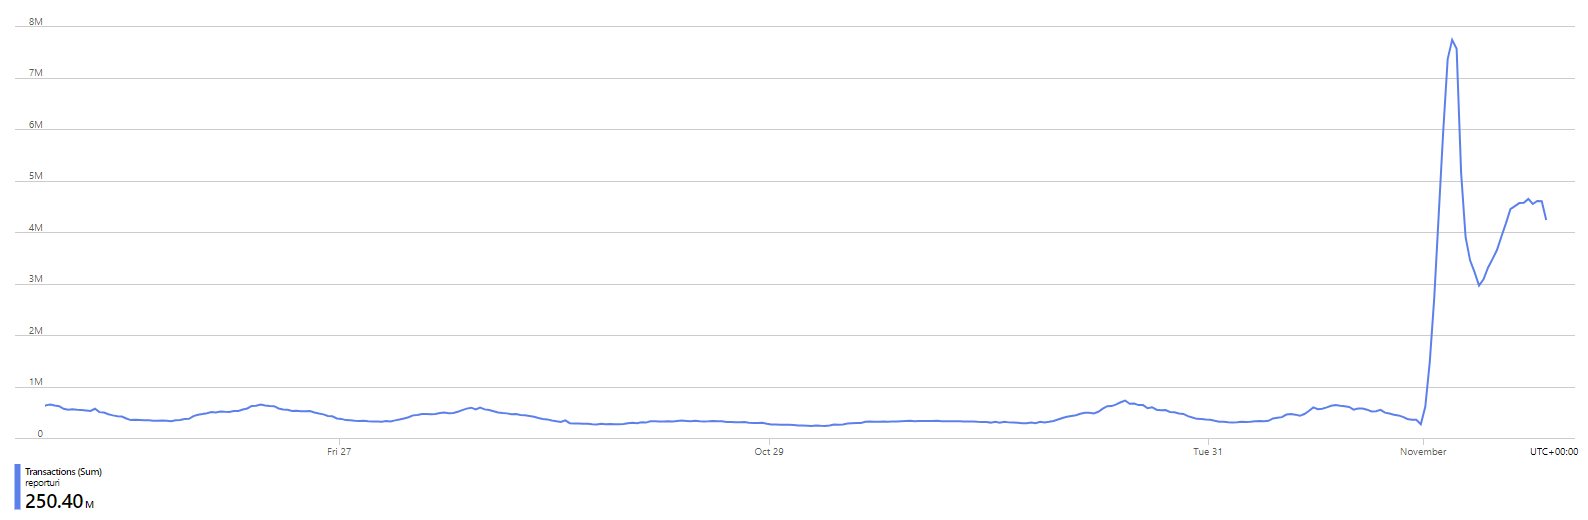
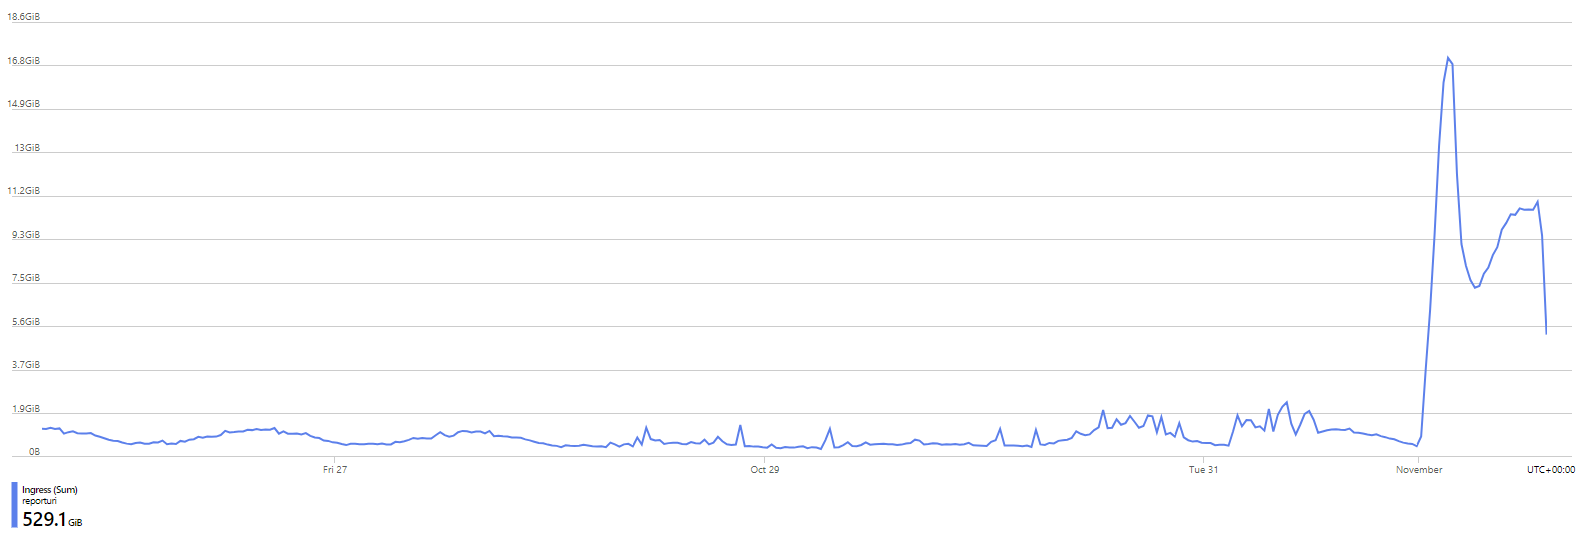
This is our rate of transactions against Table Storage for the last week and as I happen to be writing this blog post on the 1st Nov 2023, all of our users have just had their monthly quota renewed. This happens at 00:00 UTC on the 1st day of each calendar month and it's why there is an enormous spike at the start of this graph and things were a lot more quiet before that. Of course, as we progress through a month, more of our users will exceed their monthly quota and reports will stop making it to persistent storage, mostly being dropped by the Cloudflare Worker and some by the consumer servers. It doesn't stop the reports being sent, it just means that we don't process them into persistent storage. Our current rate of transactions will slowly decline from where it is now down the the lowest levels by the end of the month again. As you would expect, our ingress and egress patterns follow the same trend.
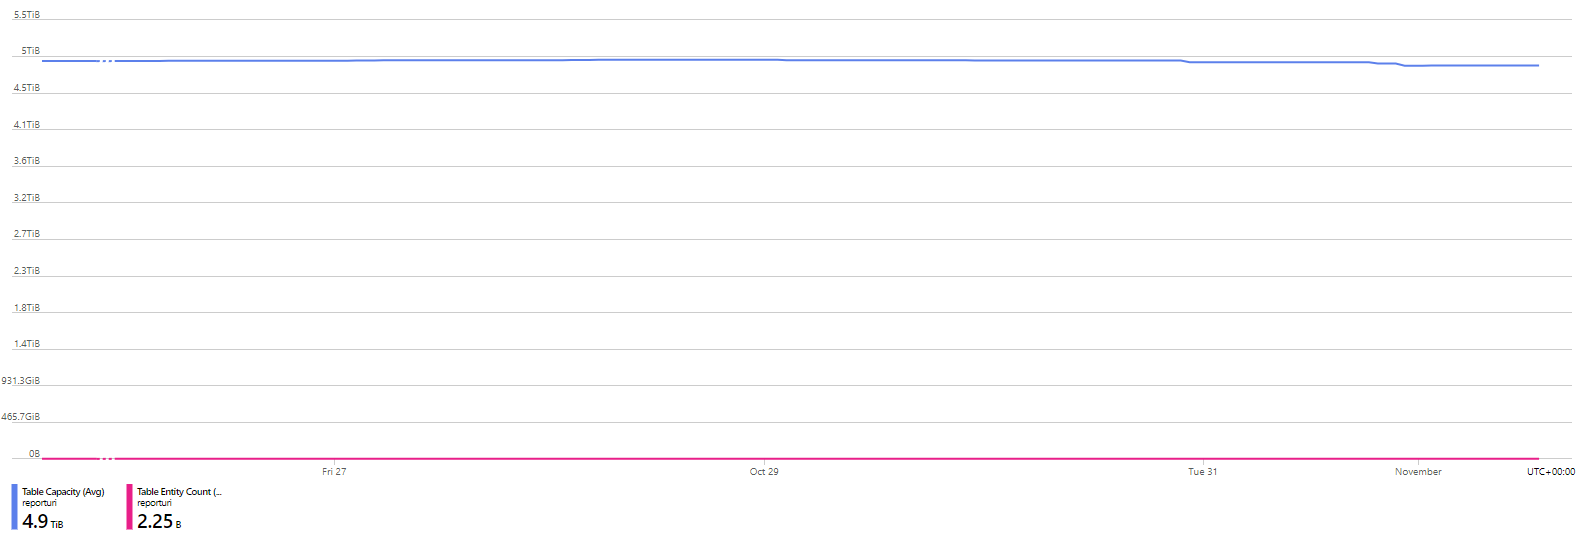
Something that was introduced quite some time ago was our 90-day retention period on report data. We will keep aggregate, count and analysis data for as long as you want, but the raw JSON of each inbound report will be purged after 90 days. We had to, simply because we couldn't store that much information for an unlimited period of time. Despite that, we still have an impressive 4.9 TiB of data on disk consumed by 2,250,000,000 entities (reports)!
That's quite a lot of JSON! 😅
Where do we go from here?
Whilst all of the above are amazing numbers, you may have noticed that our current report volumes are lower than those we have previously peaked at which were detailed at the start of this post. This is a trend I've been following for a while now and I've been able to put it down to a few things. The biggest impact is that we've made really significant progress in helping our customers get up and running more quickly. Sites always send more reports and telemetry when they're first starting out using these technologies and the faster we can help them get their configurations matured, the faster they can reduce the volume of reports they're sending. Despite this, we're always adding new sites, so even though our users are using less reports on average, as we continue to grow, this has prevented our total volume from decreasing too much by constantly bringing new users on board.
Over the next year or so, we're also helping a lot of sites get ready for the new PCI DSS 4.0 requirements and we're hoping to bring larger providers on board to provide our solution through them. The PCI SSC are putting a huge pressure on sites with an e-commerce component to protect against Digital Skimming Attacks (a.k.a. Magecart) by locking down the JavaScript on their payment pages, something that CSP was literally designed for! As the natural choice for a reporting platform, we're well suited to help sites get their CSP defined, tested and deployed with the least friction possible.
I'm excited for what the rest of 2023 will bring, but I'm looking forward to 2024 already. Having built this company up from the first line of code almost 9 years ago, to where we are today, I wonder if it might be time to take the next big step soon! 😎