
I recently announced another huge update for https://report-uri.io and I covered all of the new features in a separate blog. Alongside that I'm going to be publishing a mini-series on the various performance changes I've made to boost performance.
![]()
Azure Table Storage
I've written a few articles now about Azure Table Storage. There's Choosing and using Azure Table Storage for report-uri.io, Working with Azure Table Storage - The Basics and of course my PHP Session Store is held centrally in Table Storage too as it's perfect for the role. The gist is I use it extensively and report-uri.io is fully dependent upon it. Any optimisations I can squeeze out of my interactions with Table Storage would have a significant impact on the performance of report-uri.io in many ways.
Avoiding slow queries
When querying entities out of Azure the fastest possible way to do that is with both the PartitionKey and RowKey. These are the only indexed fields in Table Storage and any query that utilises both of these will be returned in a matter of a few milliseconds. I've structured the service so that as many of my queries as possible will use both the RowKey and PartitionKey and I only actually had one query that didn't use these indexed fields. When a report comes in I look at what I call the reportToken and perform a lookup for the associated user. If reports are sent to the following address, the reportToken would be scotthelme.
Old style report-uri.
https://report-uri.io/report/scotthelme
New style report-uri.
https://scotthelme.report-uri.io/r/default/csp/enforce
To check that this user does exist, that they're activated and to retrieve their filter settings so I can handle the report accordingly, I have to look them up. For my user table I use the email address as the RowKey for the fastest query speed during account creation and login, but this means that looking up the user on the reportToken property is not indexed and much slower. Because reports are sent asynchronously by the browser in the background and don't impact the performance of the page being visited, this wasn't a big concern initially. Now that I'm handling 100,000,000 CSP reports a week, these slower queries against Table Storage are taking up resources on my servers! The possible solutions were to create a new table where I could keep a list of reportToken values as the RowKey and a reference back to the user entity, but that seemed a little messier than I'd like, or to cache the result of the query on the application server for a short period to avoid going to Azure for every single incoming report.
Memcached to the rescue
After a series of performance tests it was clear that using memcached to store a local copy of the user entity was going to offer me a huge advantage. Each application server is now running a local instance of memcached and will query the user entity out of Table Storage if it doesn't exist in the local cache. The local copy is only valid for 60 seconds so that data always refreshes frequently (changes to filter settings for example) but during those 60 seconds the application server will not have to make a call to Azure for each incoming report just to get the user entity. The 2 key advantages here are that I've cut one of the round trips to Azure out and the round trip that I have cut out was the slowest query. This is the impact the change had:
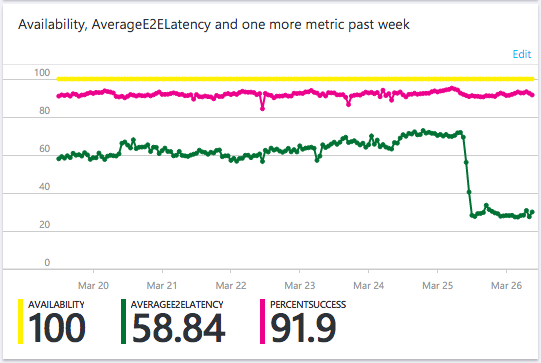
I think this graph is awesome and it really shows the value of using indexed properties in your queries in Azure. Now that my servers aren't doing the property query on the reportToken for each incoming report, the average latency of my queries against Azure has plummeted! This means that the queries take up less resources on my application servers and I'm avoiding hitting the network in the absolute vast majority of cases when I need to lookup a user based on their reportToken. Because I'm using the CodeIgniter MVC, the change was simple:
if($this->cache->get($cacheKey))
{
    return $this->cache->get($cacheKey);
}else
{
    ... // Normal query code.
    // Save the entity in the cache for moar speedz.
    $this->cache->save($cacheKey, $entity, 60);
    // Return the user entity.
    return $entity;
}
A quick update to the appropriate model to check the cache first was all that was needed. If the cacheKey doesn't exist then it will run the normal query that it ran before and save a copy in the cache with a 60 second life right after. Subsequent reports that come in for the same user in the next 60 seconds can now avoid a slow lookup to Azure.
Reducing the size of payloads to and from Azure
I've cut out queries or used faster queries where possible above, the next step was to reduce the size of the payloads I exchange with Azure to lower the round trip time and make the queries execute a little faster.
Query Projection
The biggest load on my infrastructure is saving the incoming reports into Azure. I'm already getting 100,000,000 reports a week that need to be stored and the vast majority of them (roughly 92%) are duplicates of reports that already exist. To check if a report already exists I use a hash of the JSON payload as a RowKey lookup. If the lookup returns an entity, I simply increment the count and put it back, if the lookup fails, the entity doesn't exist so I insert a new one. This is what the 91.9% success rate is in the graph above, the 8.1% of queries that fail are the RowKey lookups for entities that don't exist. Here was the previous code to do this:
// See if the entity exists.
$result = $this->tableRestProxy->getEntity($table, $partitionKey, $rowKey);
// Get the entity.
$entity = $result->getEntity();
// Increment the counter.
$entity->setPropertyValue('count', $entity->getProperty('count')->getValue() + 1);
// Update the database.
$this->tableRestProxy->updateEntity($table, $entity);
The getEntity() call is a RowKey lookup which is the fastest possible query you can do in TableStorage. The problem is that it was returning the entire entity which contains the raw report data, all of the properties I set like hostname, timestamp, browser etc... and I just don't need them. That's information going over the wire in both directions that's redundant. The only value I actually need it to return to me if the entity exists is the count, so a quick re-work gave me this:
// Build the filter string.
$filter = "PartitionKey eq '" . $partitionKey . "' and RowKey eq '" . $rowKey . "'";
// Build the query options as we don't need to return all of the entity data.
$options = new QueryEntitiesOptions();
// We only need the count property returning so select that.
$options->addSelectField('count');
// Pass in the filter string.
$options->setFilter(Filter::applyQueryString($filter));
// Perform the query.
$result = $this->tableRestProxy->queryEntities($table, $options);
// Get the entities.
$entities = $result->getEntities();
// Providing the PartitionKey+RowKey will only return 1 entity.
if(count($entities) === 1)
{
    // Get the first item in the array.
    $entity = $entitities[0];
    // Increment the counter.
    $entity->setPropertyValue('count', $entity->getProperty('count')->getValue() + 1);
    // Add the RowKey and PartitionKey for the merge.
    $entity->setRowKey($rowKey);
    $entity->setPartitionKey($partitionKey);
    // Update Table Storage.
    $this->tableRestProxy->mergeEntity($table, $entity);
}
There is a slight change here to use queryEntities() instead of getEntity() but after performing tens of thousands of these queries in testing to compare the performance, as long as you pass in both the PartitionKey and RowKey to queryEntities() it's just as fast as a getEntity() call. If I then use the addSelectField() to limit the return payload to be just the count, it's slightly faster due to the smaller payload being returned. This also has the same effect on the mergeEntity() call as the only thing I'm sending back to Azure is the PartitionKey and RowKey for the entity along with the new count. The mergeEntity() call allows me to provide a subset of the entity properties rather than the entire entity when updating the count. This means I get a performance boost in both directions and a cost saving on my bandwidth as I'm now exchanging smaller payloads with Azure!
Update: After performing this testing and then deploying the changes into the live environment the results I saw were not what I was expecting. My tests involved performing literally tens of thousands of these queries against Azure and timing them. The difference was so small that on any given round of testing one method could be faster than the other by a few milliseconds (batches of 500 queries at a time). When I deployed the changes on March 27th though that's not what I saw.
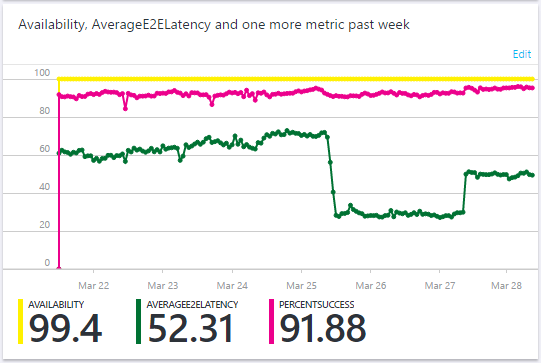
Ignore the anomaly on the very left edge of the graph, that's a bug in the dashboard that crops up every now and again, but on March 25th you can see the drop in latency I mentioned above. I deployed the mergeEntity() and QueryEntitiesOptions() update on the 27th March and saw an increase in latency. This was the only change deployed on that day and I can't explain why returning a subset of the entity properties, a smaller payload, would increase the latency of the query. It still has the PartitionKey and RowKey for the query, so it should be faster. Further investigation is required, and my tests still show that these methods should be an equivalent speed, so I can't explain the rise in latency. I did however see the expected drop in bandwidth consumption with the update.
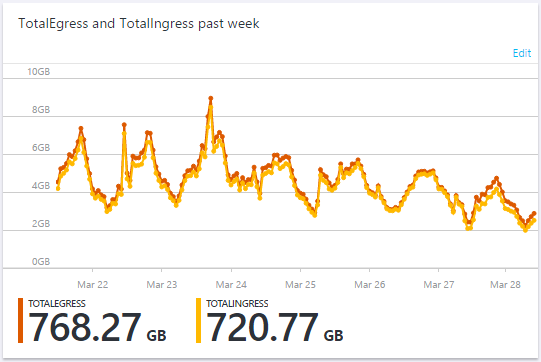
Looking at where the typical peaks and troughs in that graph are, and where they are after the update on the 27th, there's quite a saving! Transactions against Table Storage are cheap, about $0.04 per million, but the outbound bandwidth cost has more of an impact for me at $88.65/TB. Because the bandwidth is expensive, and reports are sent by the browser asynchronously in the background so the latency has no impact, I will keep the current method while I investigate further.
Gzip all the things
When talking with Azure the client libraries don't support compression so there was some potential for me to optimise by compressing the raw JSON payloads I receive before inserting them into Table Storage. The saving here would be twofold. The bandwidth into and out of Azure would be reduced which results in better performance and lower cost, but I'm also charged for the storage space I use in Azure too so there's another saving to be had. Of course, there's no point in compressing data if the time to compress it is longer than the saving on the wire, so I went back to my test environment and hammered a few hundred thousand real reports through it with and without compression. The results of that testing were clear, it was always worth compressing the data as the JSON payloads compress down really well. I did look at varying the level of compression depending on the payload size but the additional savings to be had were minuscule compared to the enormous saving of just compressing at level 1.
$entity->addProperty('data', EdmType::BINARY, gzcompress($postData, 1));
$entity->addProperty('gzip', EdmType::INT32, 1);
When I add the raw data to the entity now I simply gzip compress it and I also set another property 'gzip' to indicate that the 'data' property is compressed. When handling old and new reports I can now test for the presence of 'gzip' and know that I need to uncompress the 'data' property before use. The time taken to compress the data before inserting and then uncompress on the way out is less than the reduction in the transfer time so overall it results in a minor performance boost but is saving me 30%-50% in storage too. I have some more extensive figures here on my PasteBin account.
Caching historic queries
On the graph page, and let's take the 1 week view as an example, the query has to get the totals for the current day and the 6 previous days. The only values that have the possibility of changing here are the totals for the current day, the previous 6 days will never change. Historically, the query would have pulled out the data for all of the 7 days and counted up the totals to display in the graphs. What happens now is that for previous days it will search the partition for a totalCount RowKey first. If that doesn't exist, it will query out all entities and count up the totals and then save them under this new RowKey prior to returning the results to the GUI. This means that it will never need to retrieve and count all entities for that given time period again! Needless to say this was a fairly obvious optimisation but it's interesting how things that don't originally start out as problems or considerations become problems and need considering!
// Get the total count for a previous day.
$result = $this->tableRestProxy->getEntity($table, $partitionKey, "total");
// Get the entity.
$entity = $result->getEntity();
// Get the total count.
$total = $entity->getProperty('totalcount')->getValue();
// Count how many were a known type.
$known = 0;
// Get the count for each directive.
foreach($this->_get_valid_directives() as $validDirective)
{
    // Add it to the array.
    $directiveTotals[$validDirective] = $entity->getProperty(str_replace("-", "", $validDirective)) ? $entity->getProperty(str_replace("-", "", $validDirective))->getValue() : 0;
     // Count how many were of a known type
     $known += $directiveTotals[$validDirective];
}

// Count how many were of an unknown type.
$directiveTotals["unknown"] = $total - $known;
// Set the flag to indicate we have a total.
$haveTotal = true;
This section of code simply checks for the existence of a cached result in Table Storage and uses that if it finds one. The haveTotal flag is then used to skip over the current iteration of the loop and if no total was found, it continues as normal and creates one when it's done. This means the first time you run the graph page it could be a little slow whilst it generates the totals for previous days/weeks but after that it will be much quicker as the overhead has been greatly reduced.
I've only implemented these changes on the graph pages for now but the results look quite promising and if it works out, I will roll this out to the reports page too, though it could be a little more complicated there. On the graph pages I only have to worry about total counts for each report type, a pretty small amount of data. For the reports page each report has an associated JSON payload and many more properties. Storing the results of one of those queries brings other considerations with it.
More to come
Even with the recent update and the improvements mentioned in this article, I'm already working on the next batch of features! If you have any features that you'd like to see, or bugs you want to report, head on over to GitHub and raise them there :-)