
Last week we announced support for a new type of report on Report URI, Network Error Logging, or NEL reports. These reports are going to unlock a seriously huge amount of really helpful data so it's well worth me doing a deep dive on exactly how you can use NEL and what it can tell you.
Network Error Logging
You can read the NEL spec online but I'm going to cover basically all of the functionality here so you can save yourself the trouble of reading a spec document! Much like other features built into the browser such as CSP that allow the browser to send reports, the browser can now send NEL reports too. The difference is that unlike CSP, NEL doesn't require you to build a policy, it's simply an on/off switch that you need to flick. This should make the adoption and deployment of NEL considerably easier than CSP which does require a little configuration. That's really awesome so let's start off by turning it on and then looking at what it does.
Report-To: {"group":"default","max_age":31536000,"endpoints":[{"url":"https://{subdomain}.report-uri.com/a/d/g"}],"include_subdomains":true}
NEL: {"report_to":"default","max_age":31536000,"include_subdomains":true}
What you need to do is set 2 different HTTP response headers, Report-To and NEL. The Report-To header defines where reports should be sent by the browser and is part of the new Reporting API. Going forwards this will be used as a common feature for enabling the browser to send various pieces of information. Let's break apart the JSON that was sent in the Report-To header.
{
    "group" : "default",
    "max_age" : 31536000,
    "endpoints" : [
        {"url" : "https://scotthelme.report-uri.com/a/d/g"}
    ],
    "include_subdomains" : true
}
Here we've defined a reporting group called default, told the browser to remember these settings for a year with the max_age directive, provided the endpoints URL where reports should be sent and with include_subdomains we can ask for reports about all of our subdomains to be sent here too. Looking at the content of the NEL header we can see it's really simple.
{
    "report_to" : "default",
    "max_age" : 31536000,
    "include_subdomains" : true
}
Delivering the header turns the feature on, the report_to directive lists the name of the group in the Report-To header where reports should be sent and the max_age tells the browser how long it should send NEL reports for after receiving this header. The include_subdomains flag does what it says on the tin.
The Reports
This is the really exciting part of NEL, what reports will we receive?! Well, there are a lot of things covered by NEL and they're all pretty much things you should really want to know about. Have you ever seen a full page warning in Chrome like this?
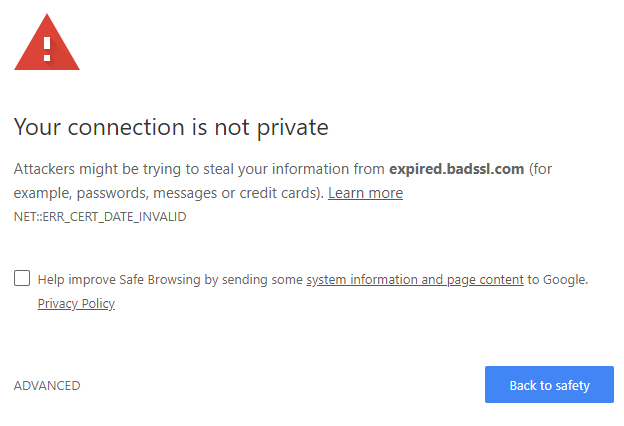
I have, you have, I'm pretty sure everyone has and they can happen for a whole heap of reasons. The DNS resolution failed, the certificate has expired, redirect loops, TLS protocol or cipher issues, HTTP failures and countless other problems. Well, you can now get a report when a whole variety of them happen! Just take a look at this list of error codes to get started.
dns.unreachable
    DNS server is unreachable
dns.name_not_resolved
    DNS server responded but is unable to resolve the address
dns.failed
    Request to the DNS server failed due to reasons not covered by previous errors
dns.address_changed
    Indicates that the resolved IP address for a request's origin has changed since the corresponding NEL policy was received
tcp.timed_out
TCP connection to the server timed out
tcp.closed
The TCP connection was closed by the server
tcp.reset
The TCP connection was reset
tcp.refused
The TCP connection was refused by the server
tcp.aborted
The TCP connection was aborted
tcp.address_invalid
The IP address is invalid
tcp.address_unreachable
The IP address is unreachable
tcp.failed
The TCP connection failed due to reasons not covered by previous errorstls.version_or_cipher_mismatch
The TLS connection was aborted due to version or cipher mismatch
tls.bad_client_auth_cert
The TLS connection was aborted due to invalid client certificate
tls.cert.name_invalid
The TLS connection was aborted due to invalid name
tls.cert.date_invalid
The TLS connection was aborted due to invalid certificate date
tls.cert.authority_invalid
The TLS connection was aborted due to invalid issuing authority
tls.cert.invalid
The TLS connection was aborted due to invalid certificate
tls.cert.revoked
The TLS connection was aborted due to revoked server certificate
tls.cert.pinned_key_not_in_cert_chain
The TLS connection was aborted due to a key pinning error
tls.protocol.error
The TLS connection was aborted due to a TLS protocol error
tls.failed
The TLS connection failed due to reasons not covered by previous errorshttp.error
The user agent successfully received a response, but it had a 4xx or 5xx status code
http.protocol.error
The connection was aborted due to an HTTP protocol error
http.response.invalid
Response is empty, has a content-length mismatch, has improper encoding, and/or other conditions that prevent user agent from processing the response
http.response.redirect_loop
The request was aborted due to a detected redirect loop
http.failed
The connection failed due to errors in HTTP protocol not covered by previous errorsabandoned
User aborted the resource fetch before it is complete
unknown
error type is unknownSome of these are things that are going to be really helpful for site operators to monitor. Take the tls.cert.date-invalid for example, I've tweeted countless times recently about sites that are serving an expired cert and that's often the first they hear of it. Imagine if visitors to your site were sending reports about that, in real-time, the second they visited your page? Yes of course we can say certs shouldn't expire in production, but they clearly do. The question is how quickly do you want to know about it? The dns.name_not_resolved could alert you to DNS resolution problems for your visitors, a variety of the tcp errors would be great for knowing about configuration or availability issues on your site and the same goes for tls.version_or_cipher_mismatch which could be a great tip off about configuration issues on your site. Then of course we step into the application layer with http.response.redirect_loop and generic 400 or 500 tracking which can quickly alert you to issues. With NEL configured these are some examples of the JSON payloads the browser would send.
{
  "age": 0,
  "type": "network-error",
  "url": "https://new-subdomain.scotthelme.co.uk/",
  "body": {
    "sampling_fraction": 1.0,
    "server_ip": "",
    "protocol": "http/1.1",
    "method": "GET",
    "status_code": 0,
    "elapsed_time": 48,
    "type": "dns.name_not_resolved",
    "phase": "dns"
  }
}
{
"age": 0,
"type": "network-error",
"url": "https://scotthelme.co.uk/some-redirect-thing/",
"body": {
"sampling_fraction": 0.5,
"server_ip": "123.122.121.120",
"protocol": "h2",
"method": "GET",
"status_code": 301,
"elapsed_time": 823,
"type": "http.response.redirect_loop",
"phase": "application"
}
}{
"age": 0,
"type": "network-error",
"url": "https://scotthelme.co.uk/",
"body": {
"sampling_fraction": 1.0,
"referrer": "",
"server_ip": "",
"protocol": "",
"method": "GET",
"status_code": 0,
"elapsed_time": 92,
"type": "tls.cert.date_invalid"
}
}Looking at your reports
With support for these reports now in Report URI, you can search through them just like you would have done for other report types if you're an existing user. If not, simply create a free account at https://report-uri.com and deliver both of the headers to enable it. Remember to update the report address with your own customised address:
Report-To: {"group":"default","max_age":31536000,"endpoints":[{"url":"https://{your subdomain here}.report-uri.com/a/d/g"}],"include_subdomains":true}
NEL: {"report_to":"default","max_age":31536000,"include_subdomains":true}
Once that's done, the reports will start showing up in your account and you can browse through them.
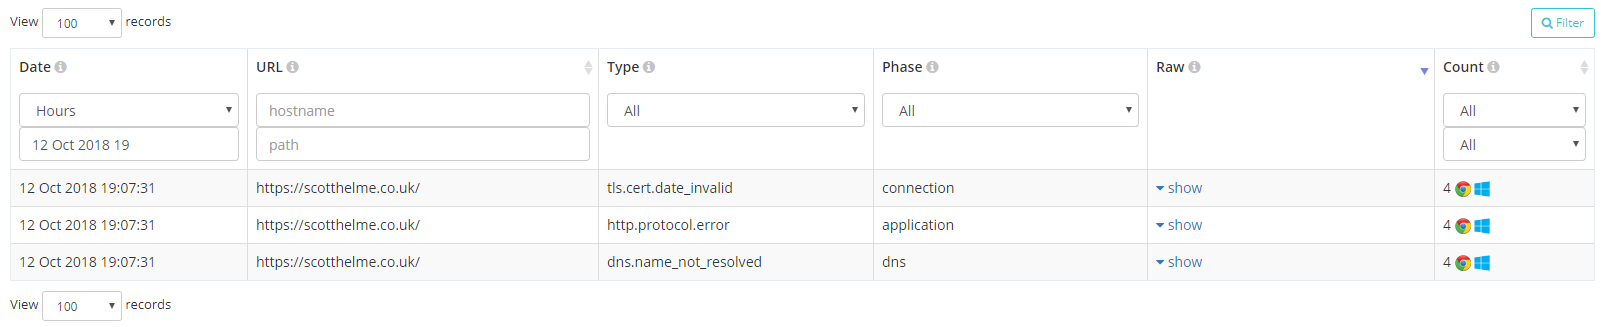
As well as all of the normal ways you can search for reports, based on Date, URL/Path, Browser and now Platform, you can search on the Type and Phase of the NEL report itself.
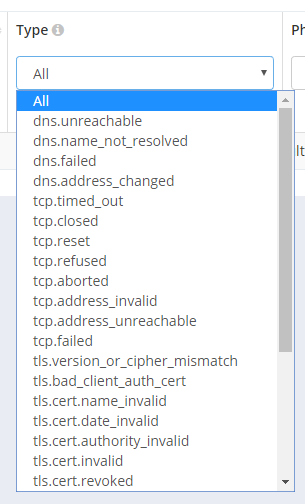
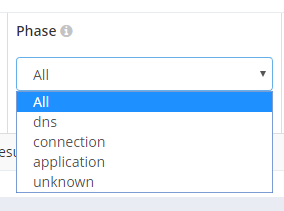
This will be really useful if you want to see all of a specific type of report like cert expiry or DNS problems, heck you can even track down all HTTP 500 errors that users saw.
Reporting successful requests
Yes, you did read that right. With NEL you can report on successful requests to your site! Now, this seems like it would generate insane amounts of reports, in theory 1 report per page load, but there is a way to easily control this. The success_fraction can be set in the NEL header and it can be set to a value between 0.0 and 1.0.
NEL: {"report_to": "default", "max_age": 31536000, "include_subdomains": true, "success_fraction": 0.5}You can read the section in the spec about this but basically if this value is present then it controls what fraction of successful network requests to your origin should have reports sent about them. If the value is not present then the default is 0.0 and no reports are sent about successful requests. The example above would result in 50% of network requests to your origin sending a NEL report and they could look something like this.
{
  "age": 0,
  "type": "network-error",
  "url": "https://scotthelme.co.uk/",
  "body": {
    "sampling_fraction": 0.5,
    "referrer": "https://scotthelme.co.uk/",
    "server_ip": "123.123.123.123",
    "protocol": "h2",
    "method": "GET",
    "status_code": 200,
    "elapsed_time": 823,
    "type": "ok"
  }
}
One thing that we're looking at making great use of here is the elapsed_time value which is defined as "The elapsed number of milliseconds between the start of the resource fetch and when it was completed or aborted by the user agent". This will be a great metric for network performance measuring and I'm planning to do a little A/B testing with this and using it for things like CDN testing in various locations. Imagine being able to test the average network latency for various regions or types of browser by varying where the NEL header is currently enabled!
Downsampling report volume
Another great thing about the new NEL header is that the reporting mechanism has the ability to down sample reports built right into it! This has previously been something that was quite difficult to achieve manually but with native support this will really help sites deploy NEL whilst generating controllable volumes of reports.
NEL: {"report_to": "default", "max_age": 31536000, "include_subdomains": true, "failure_fraction": 0.5}By defining the failure_fraction in the NEL header you can specify what fraction of reports should be sent between 0.0 and 1.0 inclusive. If the failure_fraction is not defined then it will default to 1.0 and send all failure reports to the reporting endpoint or the example just above will send 50% of the reports. This should help you cut down on a considerable volume of reports but ensure that you don't miss out on important and less frequent events.
Observing and debugging browser behaviour
The NEL feature, and the Reporting API that it uses to dispatch reports, are both brand new in Chrome and you may be curious about how they work or want to debug your current setup. To do this, Chrome has implemented an interface for you to see sites registered for NEL, information about the policies receive and any reports that you have cached locally in the queue for being dispatched.
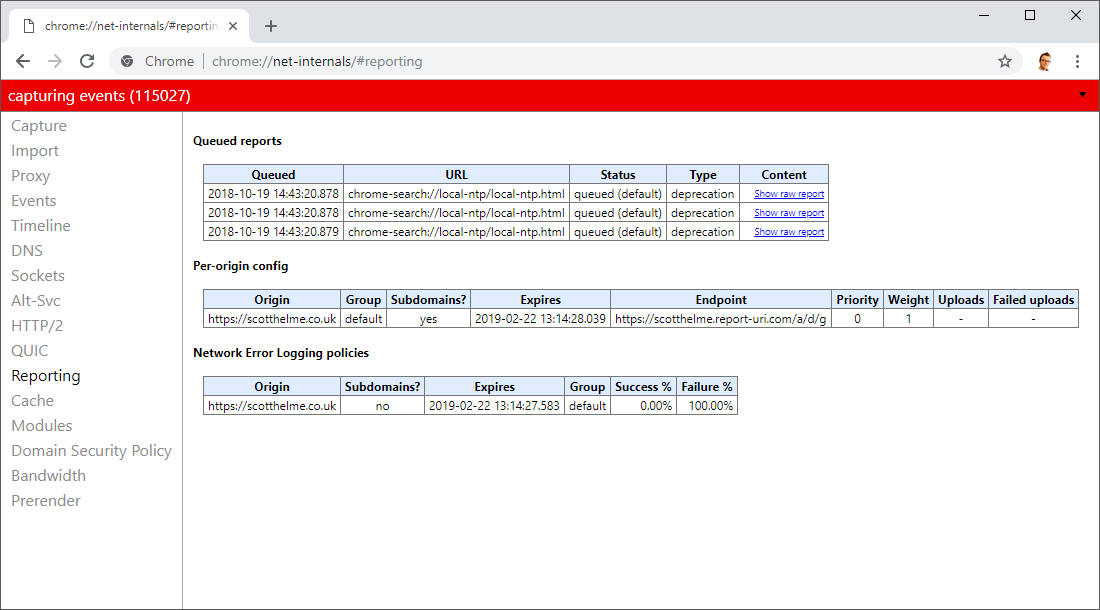
You can access this page at chrome://net-internals/#reporting and see all of the information there.
Try it out
All that's left to do is enable NEL on your site and let me know about your experience. I'm genuinely really interested to see if I start receiving information about problems that I didn't know existed or weird behaviour that previously went undetected. The worst-case scenario is that you have no problems at all and you receive no reports!