
After the two year birthday of report-uri.io I wanted to take a look at where the service is and just how much work it's doing on a day to day basis. Here are all of the details I have to share, open for public viewing.
Publishing the data
Given that my expectation was always for report-uri.io to be a small project, it's seen incredible levels of growth and is now handling more reports than I had ever anticipated. This has led to some interesting problems and learning curves for me to adapt the service and optimise it. I'm now going to publish all of the data I have at present about everything that happens behind the scenes and to show just what's involved in CSP, HPKP, Expect-CT and Expect-Staple report collection. The data comes from the Imperva Incapsula dashboards I have access to as a result of their sponsorship and in subsequent posts I will look at a mixture of the DigitalOcean and Azure dashboards to see what's going on behind the scenes too.
Raw traffic
The first thing to analyse is the raw traffic actually being sent to the site and I can get all of the data I need from the Incapsula dashboard as all of my traffic is proxied through them. Their dashboards are really good and I have access to a whole range of data, starting first of all with just how many requests are they processing for me. Just a couple of months ago my weekly traffic looked a little like this.
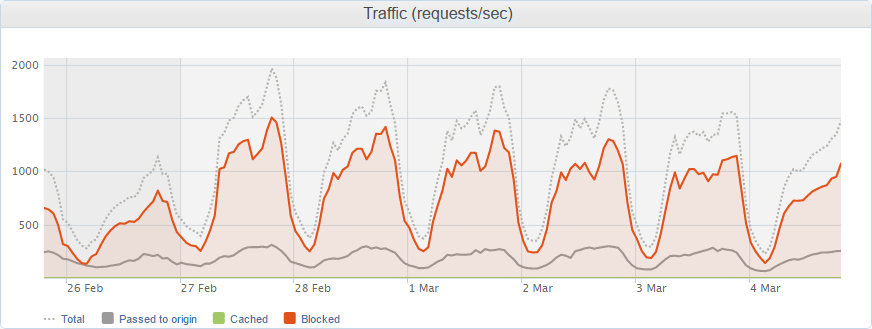
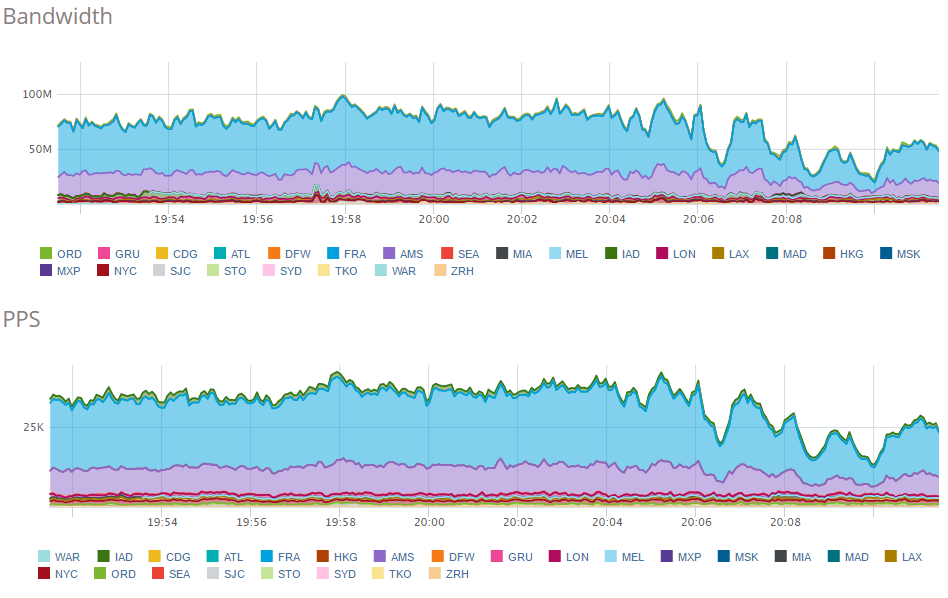
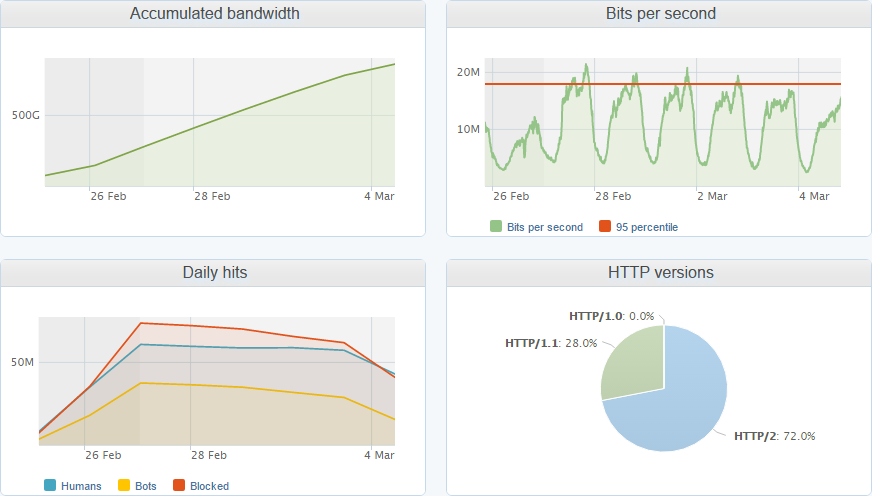
During busy periods I'm receiving well over 1,000 reports per second with regular days where it peaks at over 2,000 reports per second! This is quite a considerable amount of data and results in an ingress data rate of about ~75Mbps and egress of ~20Mbps. Here are the ingress and egress data charts from the Incapsula dashboard.
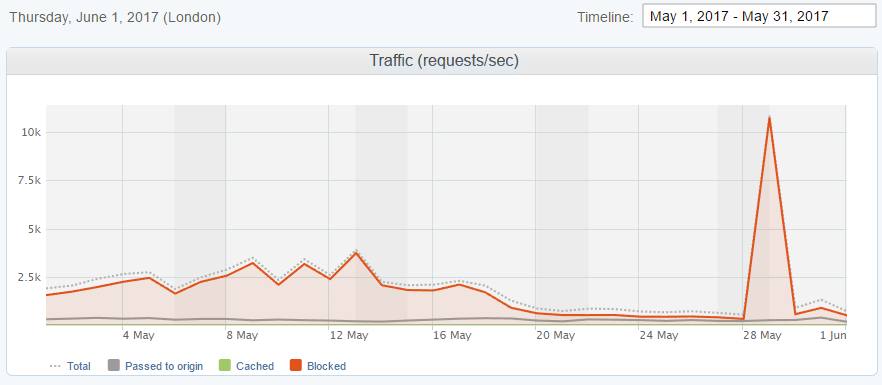
As I was getting ready to publish this blog post and do an overview of the month of May, my best month so far, someone deployed a change to their site.
All of the DDoS alarms are currently going off at @reporturi HQ!
— Scott Helme (@Scott_Helme) May 29, 2017
🚨🚨🚨
The massive influx of traffic as a result of that, largely handled by Imperva Incapsula, pushed me through a record that I never expected to set. I received well over 3 billion reports in May alone.
Traffic breakdown
I can also start to dig in to details about the traffic to see where it's coming from and who's sending it. Looking through some more of the dashboards available I can see that the majority of my traffic comes from visitors in the US and that Chrome is by far the most popular browser for sending reports. This makes sense as it's probably the most widely used browser out there.
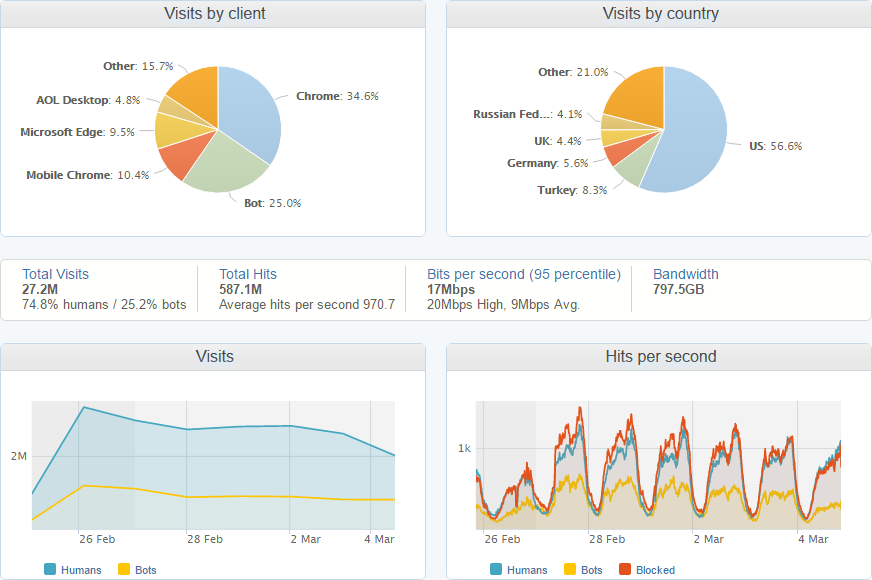
These graphs are for a 7 day period and are only for the shared reporting infrastructure, they don't included the website, test or dev environments or the dedicated reporting servers that a few clients have. That said, I'm still receiving almost 600,000,000 hits per week to this part of the service alone! The day and night cycles in the graphs are pretty obvious and there is also a notable drop in traffic at the weekend too. Looking at some more of the metrics available I'm quite impressed to see that 72% of the reports are sent using HTTP/2, which is impressive but probably not surprising as the bulk of my traffic comes from Chrome.
Dealing with bad traffic
With the growth in the service one of the things that I eventually had to do, but didn't want to do, was to introduce rate limiting. CSP is a very 'spiky' business as it is, one small configuration error or a browser bug and you can end up with DDoS levels of traffic. I detailed one particularly bad experience in my blog Just how much traffic can you generate using CSP? but those less frequent occurrences aside, sites with tens of millions of hits a day will generate a lot of traffic for reasons outside of their control. I've been really relaxed with the rate limit and the idea is to simply downsample reports so the service is still just as useful but there is less of an overhead to deal with the full amount. Just to give an idea of how relaxed that rate limit is, I allow 25,000,000 reports per month for an account which is broken down into a rate limit of 10 reports per second. I implement this as a rate limit rather than a simple count so that sites can't burn through their monthly allowance in a short period of time if they deploy a misconfigured policy, for example. With all of that in mind, it's quite surprising that I'm dropping such an enormous amount of the reports that arrive, over 427,000,000 per week!
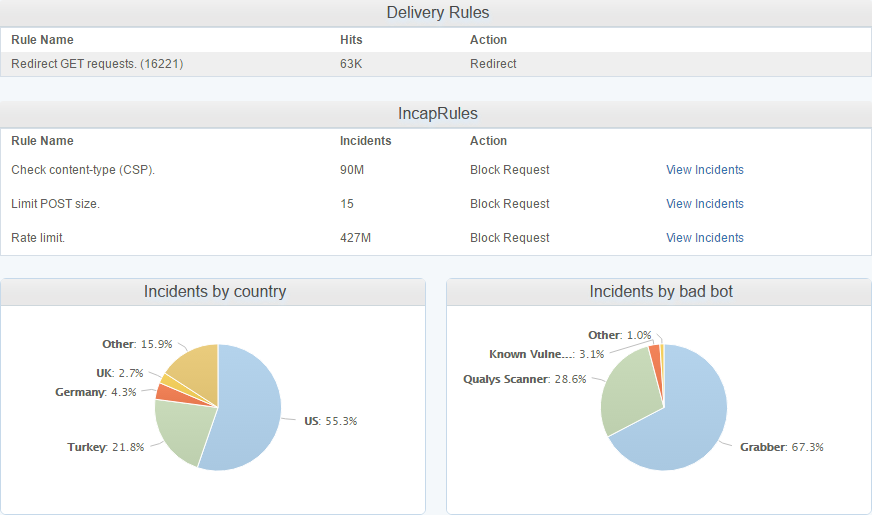
On top of the insane amount of reports that are rate limited, there are also another 90,000,000 you can see there because they were malformed. I'm really strict on the inbound reports and the browser has to send reports in the format as defined in the CSP specification or I just won't accept them. Over the weeks and months I've had various bugs open with various browser vendors and most of them have fixed their implementation so they are now fully spec compliant. The last major vendor with a bug outstanding was Edge, which they just recently patched. Lastly is the Delivery Rules at the top of that image. I've not started to leverage these fully yet and the one rule that I do have there is simply to redirect GET requests made to the reporting endpoint. This endpoint will only accept POST requests with a valid report payload so Incapsula is now redirecting GET requests made to those locations so that I don't have them hitting my servers either. The traffic I've mentioned so far has been largely legitimate traffic but either malformed or just too much of it, it's not been 'bad' as such, but I do get a lot of genuinely bad traffic and Incapsula deals with all of that too. Take these guys as literally just a few examples of the kind of things that I see:
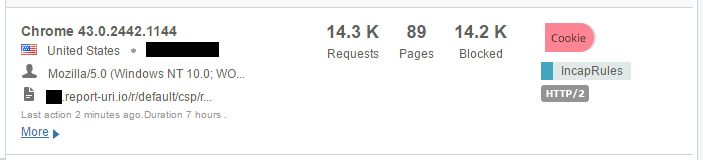
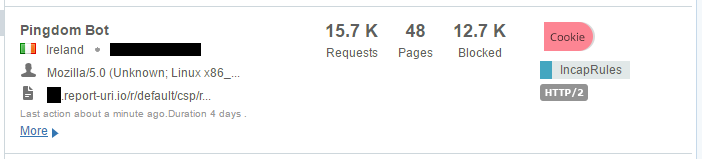
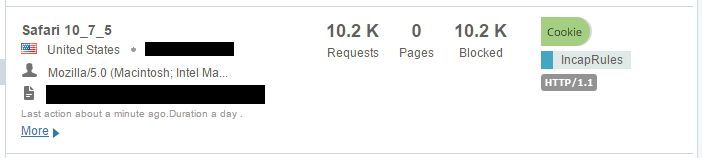
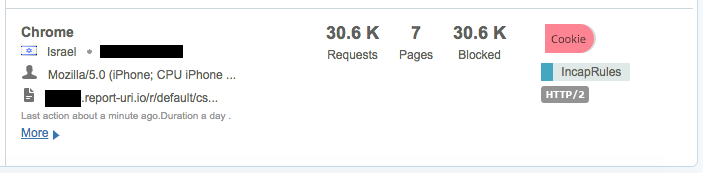
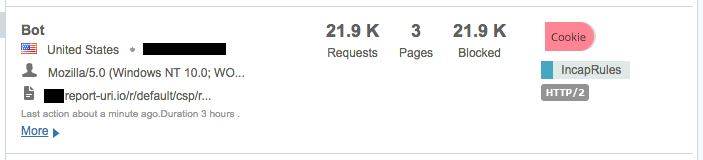
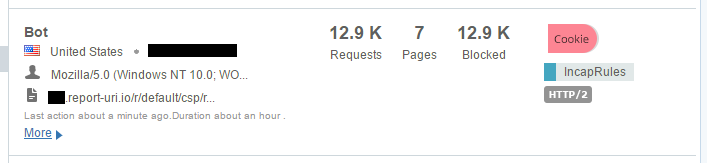
That's an awful lot of traffic to be coming from such a small number of clients and again it's all traffic that would have hit my origin servers. These are just a few samples I grabbed on the day I'm writing the blog but I have seen the odd time when one of these clients can push over 100,000 requests in a few hour period! This is traffic that I'm no longer paying to process on my origin servers.
Caching responses
One of the other services offered by Incapsula is a CDN to cache and serve content from servers close to your visitors. What's interesting about the traffic heading towards my report ingestion servers is that absolutely none of it, nothing, can be cached and served from the CDN.
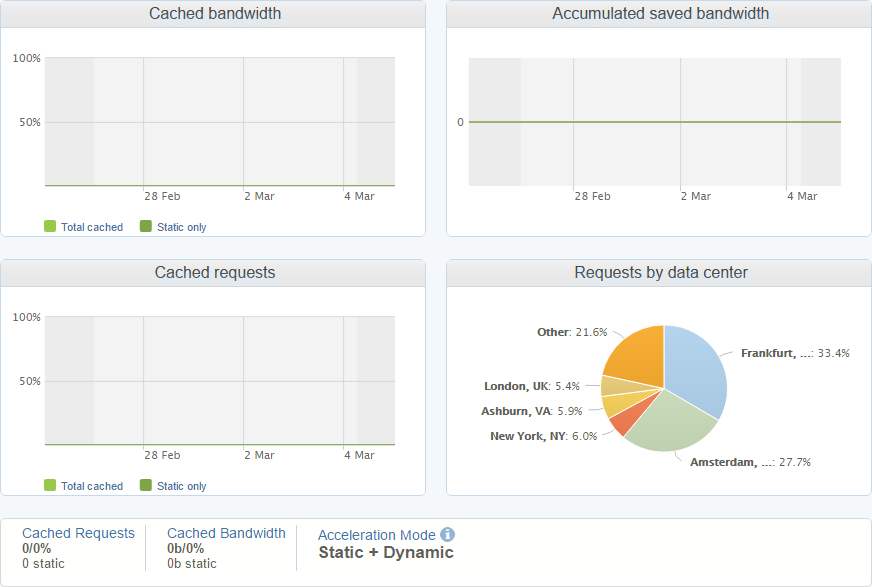
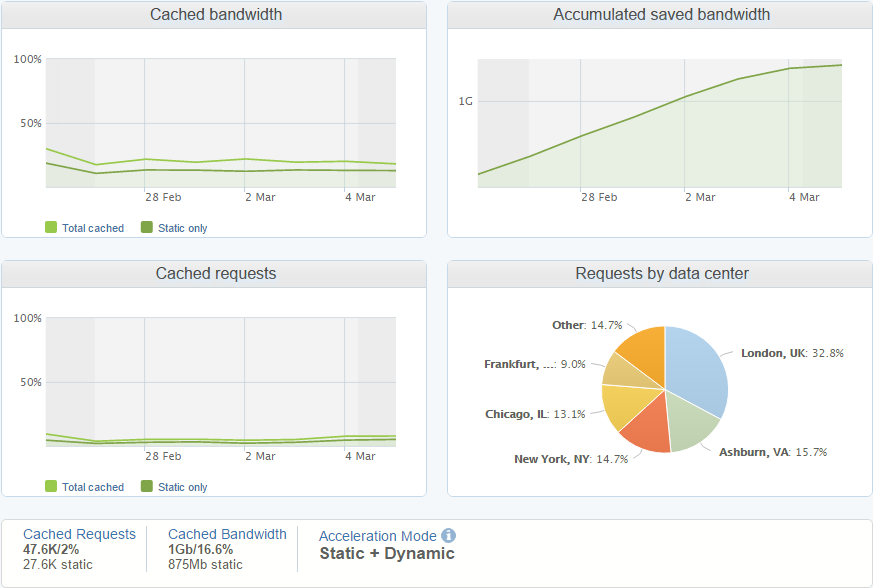
Because of the nature of the traffic there is nothing the CDN can do here and every report has to be passed to my origin. Of course, there is rate limiting and other restrictions applied on reports getting through, but they are either dropped or passed to the origin, there is no caching to be done. If I look at the dashboards for traffic being passed to my "www" servers, those hosting the website, then you can see that the CDN is helping out there and caching requests to be served from the cache.
Live traffic views
One of things that I really like about the Incapsula dashboards is the Real-Time pages. You can literally have your finger on the pulse of your entire infrastructure and see exactly what's happening, how much traffic is hitting you, being let through to the origin, the response times of servers in your origin pool and a load more metrics.
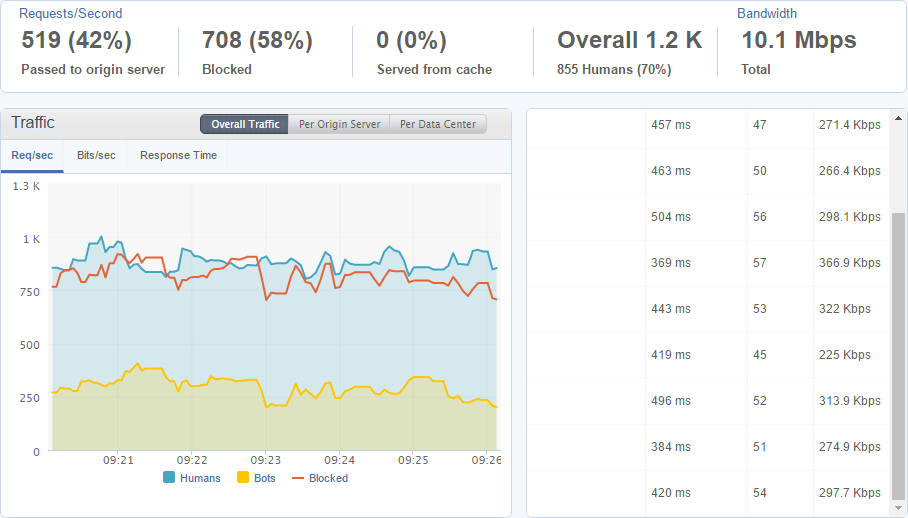
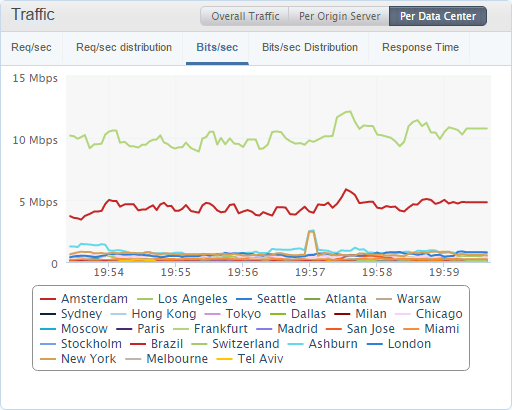
I'm writing this blog during my quiet time so this is the lowest traffic rates that I see all week and I'm still seeing ~1,200 reports per second coming in right now. Keeping an eye on the response times for each origin server is handy as it's a really good indicator of a problem if one of them is wildly out of sync with the others. I can also break the traffic down origin server or data center to see other interesting trends in the data.
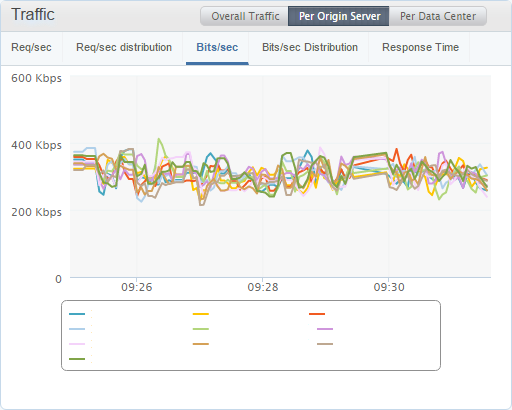
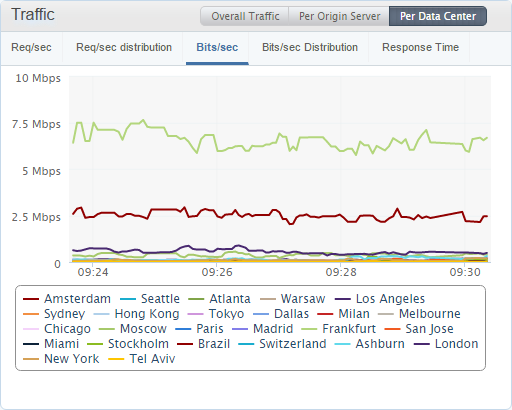
It's good to see that all of my origin servers are receiving an equal amount of traffic, which is a sign they're all operating as expected, and right now the Frankfurt and Amsterdam data centres are receiving the most traffic which makes sense as it's currently daytime in the EU while most of America is asleep.
More to come
I've covered some of the awesome areas of the Incapsula dashboard but there's still a lot more to look at. Things like how to configure IncapRules and Delivery Rules to do some more advanced filtering at the Incapsula edge, configuring health checks of origin servers and automatic fail overs, using the API to add origin servers for auto-scaling, WAF tuning, performance optimisations and whole load more! It's fair to say there's a whole heap more features than I thought there was going to be and I'm going to leverage pretty much all of them to improve report-uri.io in some way. The service is continuing to grow and at current rates I've got some interesting times ahead. There will be another big round of updates coming over the summer too!